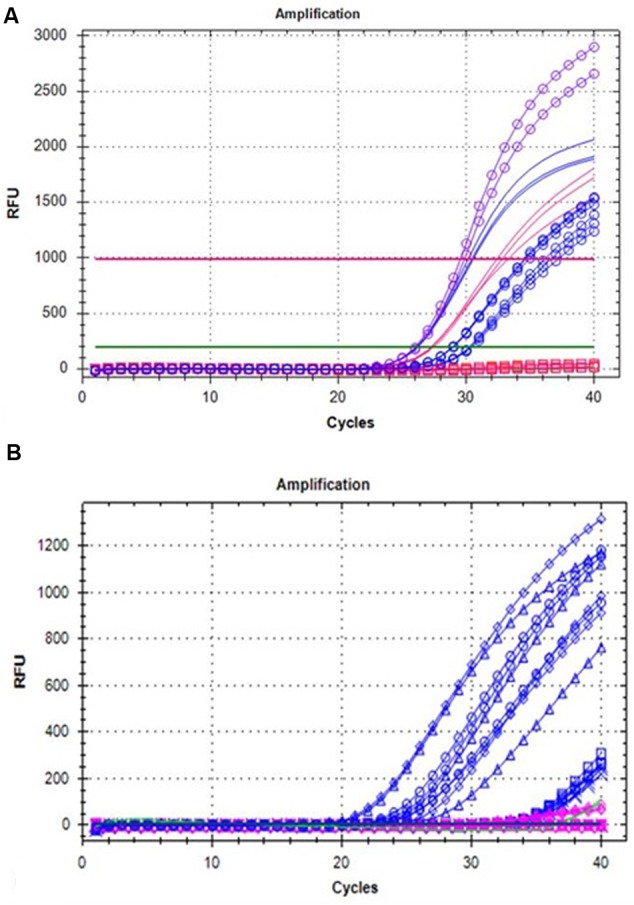
FIGURE 5.

(A) Probe analysis on genomic DNA samples of “Anne” (blue) and “Tulameen” (pink) for the 5 bp insertion (ans+5). Probe assay on both genomic DNA (blue circles), ‘pCRTM4-1840’ (violet circles) of “Anne” and genomic DNA, ‘pCRTM4-1835’ (pink squares) of “Tulameen”. Genomic DNA samples amplified from “Anne” (blue lines) and “Tulameen” (pink lines) without probe in reaction mix. (B) Probe analysis on different fruit stages of “Anne” (blue) and “Tulameen” (pink) for the 5 bp insertion (ans+5). Transcripts from different fruit stages of “Anne” exhibits fluorescent signals (blue) but none of the “Tulameen” fruit stage (pink) as indicated by the diamond (Stage 1), cross (Stage 2), triangle (Stage 3), sequence (Stage 4), and circle (Stage 5). NTC is indicated along the baseline (green).
