Figure 1.

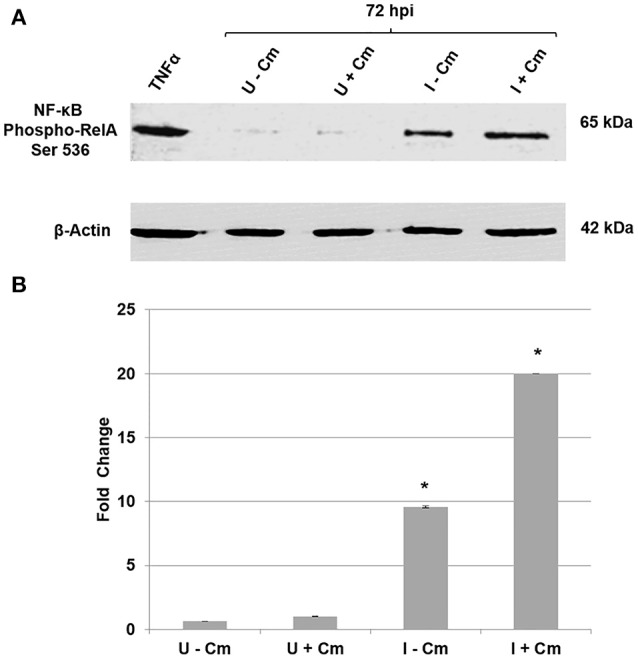
Immunoblot analysis of C. burnetii modulation of NF-κB activation. (A) Top panel—immunoblot detection of phosphorylated RelA. Bottom panel—β-actin loading control. Uninfected THP-1 cells without Cm (U−Cm). Uninfected THP-1 cells with Cm (U+Cm). Infected THP-1 cells without Cm (I−Cm). Infected THP-1 cells with Cm (I+Cm). All samples were collected at 72 hpi. TNF-α-treated cells were used as positive controls for RelA phosphorylation. (B) Graph—difference in RelA protein phosphorylation levels relative to normalized β-actin. The Y-axis represents fold changes in phosphorylated RelA and the X axis indicates samples. Results represent the mean of three independent experiments. Error bars represent ± SD. Statistically significant differences between U−Cm and I−Cm or I+Cm are represented as *P ≤ 0.001—(Student's t-test).
