Figure 3.
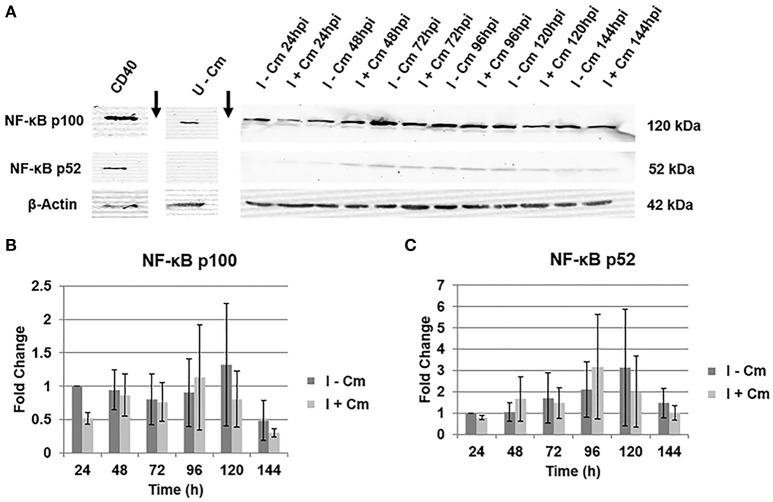
Immunoblot analysis of NF-κB p100 and p52 in C. burnetii-infected cells. (A) Representative immunoblots showing NF-κB p100 and p52 in C. burnetii-infected THP-1 cells either treated with Cm (I+Cm) or left untreated (I−Cm). Blots were probed with a polyclonal rabbit antibody against NF-κB (p100/p52) of human origin (Top/Middle panels, respectively). Bottom panel—β-actin loading control. CD40-treated THP-1 cells served as a p52 positive control. Sample conditions and time point are indicated above each lane. Arrows indicate lane breaks. (B) Results of densitometric analysis showing fold changes of NF-κB p100 levels over time of infection with and without Cm after β-actin normalization. Error bars show ±S.E.M of three biological experiments. (C) Fold changes of NFκB p52 levels over time of infection with and without Cm after β-actin normalization. Error bars show ±S.E.M of three biological experiments.

