Figure 4.
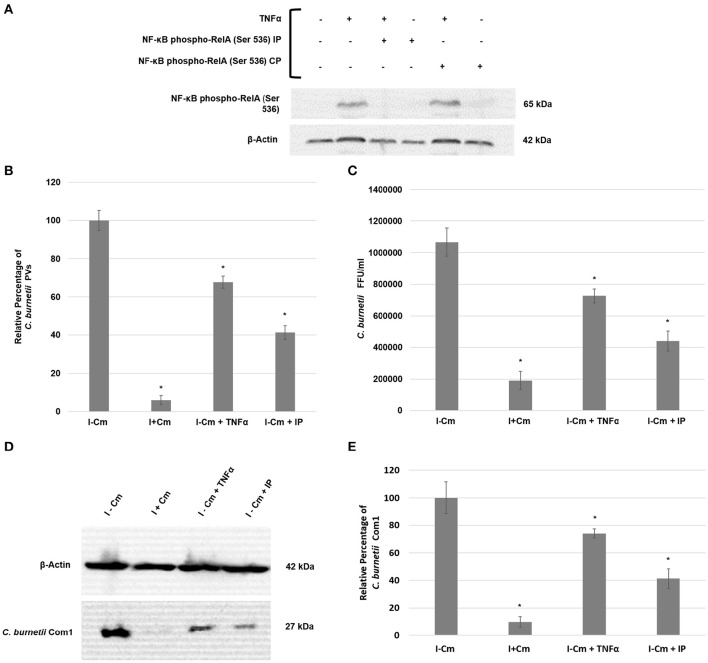
C. burnetii development following NF-κB activation or inhibition. (A) Top panel—immunoblot detection of phosphorylated RelA in THP-1 cells. Bottom panel—β-actin loading control. Sample treatments (±) are indicated above immunoblot panels and correlate to the lanes below. (B) Inhibition of RelA phosphorylation in THP-1 cells impairs C. burnetii PV formation. 15 fields of view at 20x magnification (>100 cells/field of view) from three independent samples were analyzed for PV enumeration. Error bars show ±S.E.M. Statistical differences relative to I−Cm were calculated using a t-test for paired samples (*signifies P < 0.05). (C) Infectious progeny enumeration in Hela cells from three independent samples as measured by IFA and Fluorescent Forming Units (FFUs). Error bars show ± SEM. Statistical differences relative to I−Cm were calculated using a t-test for paired samples (*signifies P < 0.05). (D) Representative immunoblot showing Com1 levels in C. burnetii-infected THP-1 cells either untreated or treated with Cm, TNF-α, or RelA IP and harvested at 72 hpi. Top panel—β-actin control. Bottom panel—Com1 detected with a rabbit polyclonal antibody. (E) Differences in C. burnetii Com1 levels relative to normalized β-actin from three independent samples were analyzed. All samples were analyzed at 72 hpi. C. burnetii growth was examined in THP-1 cells either untreated (I−Cm), or treated with Cm (I+Cm), TNF-α, or RelA IP. Error bars represent ± SEM. Statistically significant differences relative to I–Cm are represented as *P ≤ 0.05, (Student's t-test).

