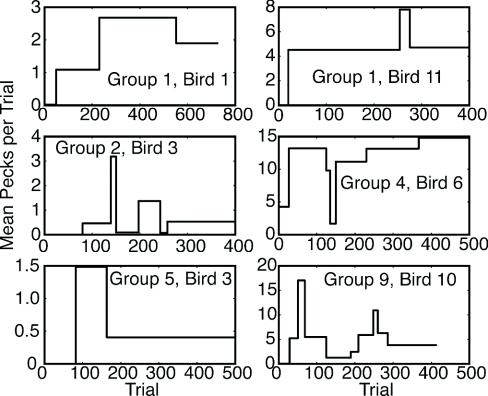
Fig. 9.
A random sample of the diverse but commonly seen ups and downs in the level of conditioned responding after its first appearance. The change points that generated these plots were detected by using the change-detecting algorithm, with a t test and a decision criterion (logit) of 6, which corresponds to a P value of <0.000001. Significant, substantial, and long-lasting decreases in performance are often seen. In other words, conditioned performance is asymptotically unstable.

