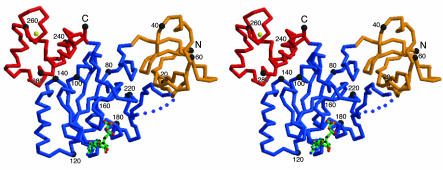
Fig. 2.
A stereo drawing of a Cα trace of TmYjeQ with bound GDP. Each domain is colored according to Fig. 1. Every 20th residue is numbered and is represented by a dot. The bound GDP is represented as a ball-and-stick model. The N (residue Leu-3) and C termini (residue Arg-293) and the secondary elements are labeled. The figure was generated by using the program molscript (31).

