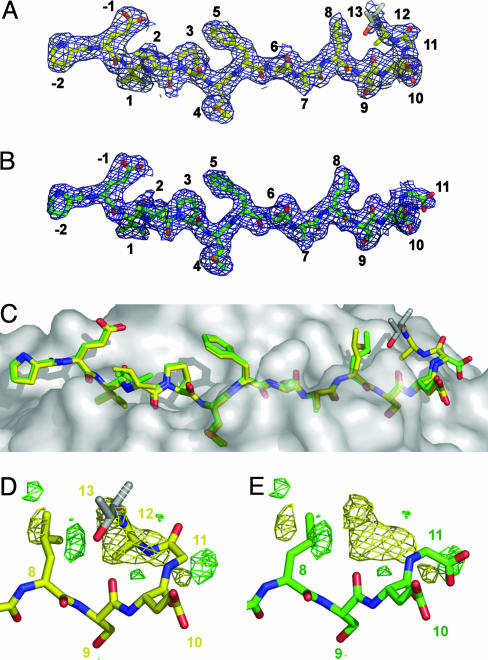
Fig. 2.
Crystal structures of DR1/Gag[PP16]/SEC3 and DR1/Gag[PG13]/SEC3. (A) A |2 Fo - Fc| electron density map calculated by using model phases and contoured at 1σ for the Gag[PP16] complex in the vicinity of the peptide. Carbon atoms are yellow, nitrogen atoms are blue, and oxygen atoms are red. (B) Corresponding map of the Gag[PG13] complex, but with carbon atoms being green. (C) Surface of HLA-DR1 showing superposition of bound Gag[PP16] (yellow) and Gag[PG13] (green) peptides. (D and E) Difference Fourier map|FGag[PP16] - FGag[PG13]| calculated by using Gag[PP16] model phases, contoured at 4σ, with positive (Gag[PP16]) density in yellow and negative (Gag[PG13]) density in green, overlaid with the Gag[PP16] peptide (D) or the Gag[PG13] peptide (E). No significant positive or negative difference peaks were observed outside this region.

