Figure 4.
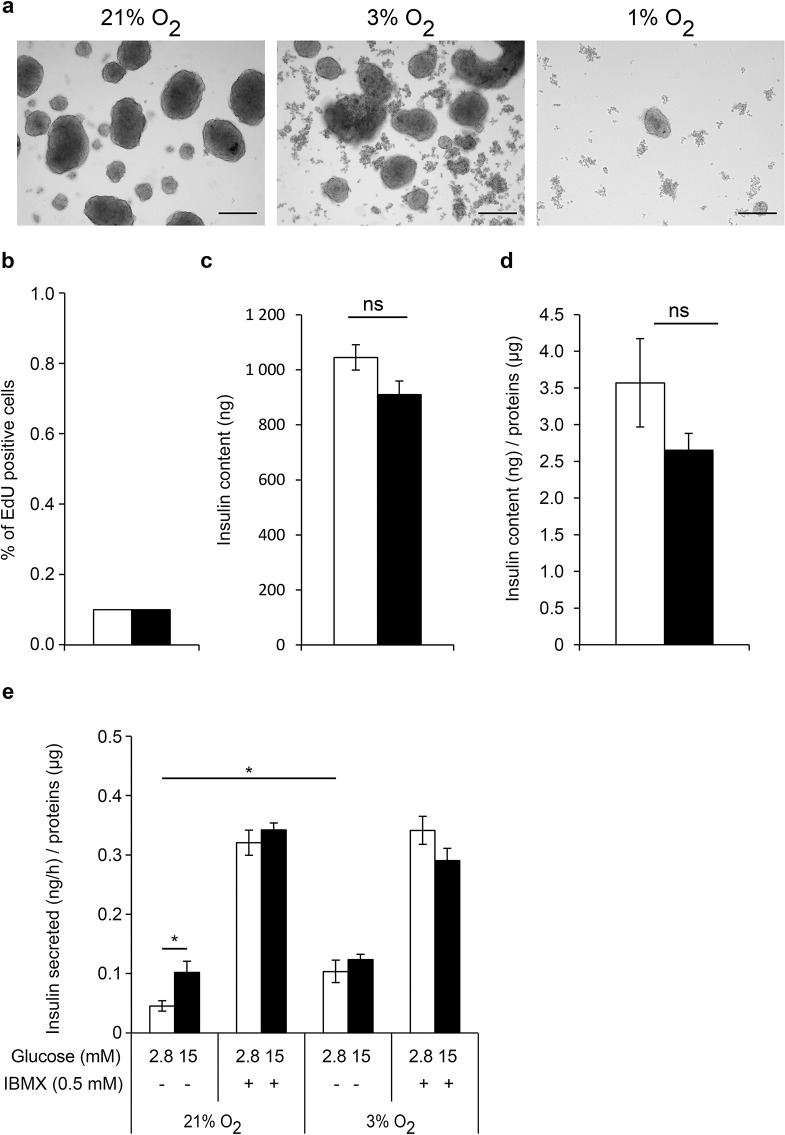
Effect of hypoxia on EndoC-βH3 viability, sensitivity to glucose, and insulin secretion capacity. EndoC-βH3 PIs were cultured under normoxia (21% O2, white bars) and hypoxia (3% O2, black bars) (b–e). Analyses were performed at day 6. (a) Morphological images of EndoC-βH3 PIs cultured under hypoxia (3% and 1% O2). Scale bars: 200 μm. Effect of hypoxia on EdU incorporation, insulin content, and GSIS in EndoC-βH3 PIs (b–e). (b) EdU was added for 1 h, and analysis was performed by fluorescence-activated cell sorting (FACS). Results are representative of two independent experiments performed in duplicates. Data are expressed as average ± SEM. (c, d) Insulin content in EndoC-βH3 PIs. Data are expressed as insulin content in nanogram of insulin (c) and in nanogram of insulin normalized per microgram of proteins (d) ± SEM of four independent wells per condition assayed in duplicates by ELISA. ns, nonsignificant. (e) GSIS on EndoC-βH3 PIs in the presence or absence of IBMX. Data are expressed as nanogram of secreted insulin per hour per microgram of proteins ± SEM of three independent wells per condition assayed in duplicates by ELISA. *p < 0.05.

