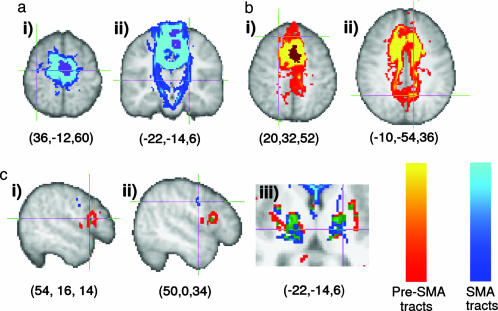
Fig. 5.
Connections from putative SMA and pre-SMA. (a) The population map of putative SMA (thresholded at more than four subjects) is purple. The group connectivity distribution ranges from blue to turquoise. Connections from putative SMA tended to go to the precentral gyrus [crosshairs in ai and the corticospinal tract (aii)]. (b) The population map for putative pre-SMA (more than four subjects) is brown. The group connectivity distribution from putative pre-SMA ranges from red to yellow. Connections from pre-SMA tended to go to the prefrontal cortex [crosshairs in bi show a termination point in the superior frontal gyrus) and medial parietal cortex (bii)]. (c) Group connectivity distributions from pre-SMA and SMA are rendered together for comparison (ci and cii). Connections from pre-SMA terminated in inferior frontal gyrus. In the precentral gyrus, connections from SMA terminated in caudal parts of the gyrus, corresponding to motor and premotor cortices, whereas pre-SMA connections terminated in more rostral, inferior parts of precentral gyrus (ciii). In the thalamus, connections from SMA traveled through the ventrolateral part of the thalamus and the adjacent internal capsule, whereas those from pre-SMA traveled through more anterior parts of the thalamus. Green regions in C represent overlap between connectivity distributions from SMA and pre-SMA. Coordinates given below each brain slice indicate the location of the crosshairs in MNI coordinates.

