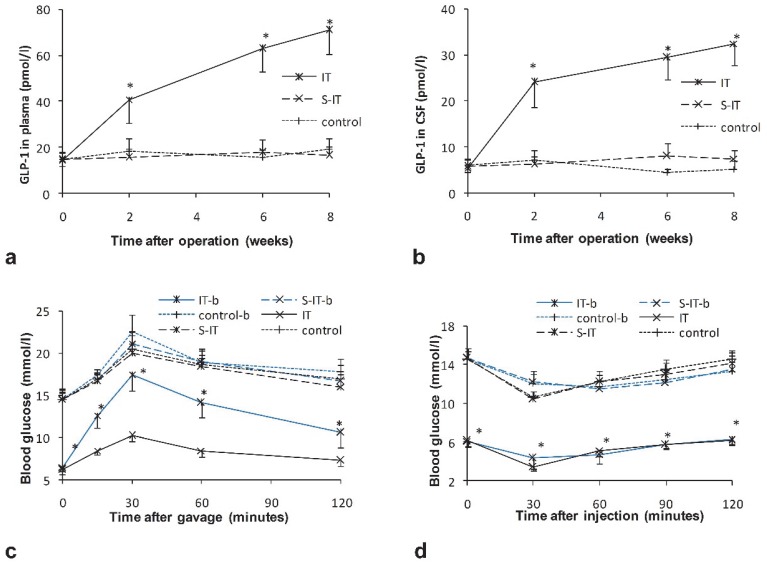
Figure 2.
the effect of GLP-1 on the improvement of blood glucose in the IT group. a. the plasma GLP-1 level of three groups. b. the GLP-1 level in the CSF of three groups. The GLP-1 level of the IT rat group was higher than that of the S-IT group after surgery. c. the blood glucose level of OGTT before central GLP-1 receptor blockade at 6th week post-operation (black lines) and after blockade at the 8th week post-operation (blue lines). Blockade of central GLP-1 receptors reduced the improvement of diabetes in the IT group. d. the blood glucose level of ITT before and after central GLP-1 receptor blockade. The sensitivity of insulin did not deteriorate more than other two groups. The asterisk means significantly different compared to the S-IT group (P < 0.05); CSF, cerebrospinal fluid; control-b, control group rats accepted central GLP-1 receptor blockade; GLP-1, glucagon-like peptide 1; IT, ileal transposition; IT-b, ileal transposition rats accepted central GLP-1 receptor blockade; ITT, insulin tolerance test; OGTT, oral glucose tolerance test; S-IT, sham ileal transposition; S-IT-b, sham ileal transposition rats accepted central GLP-1 receptor blockade.

