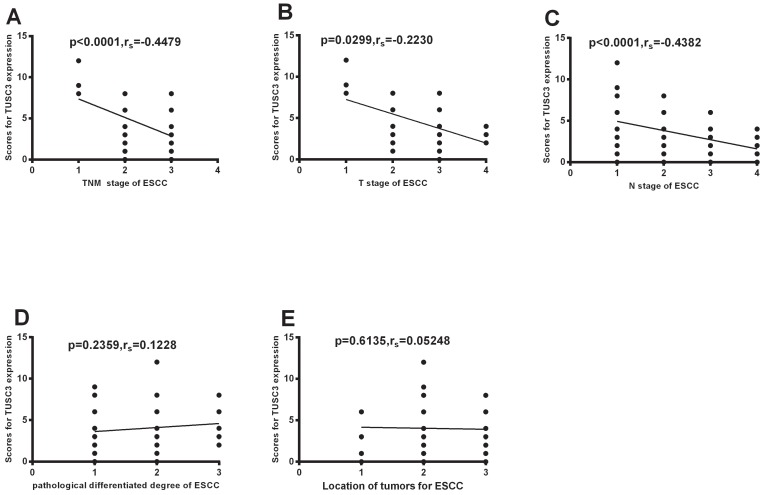
Figure 3.
Correlation between TUSC3 expressions and different clinico-pathological characteristics. Correlations between TUSC3 expressions and clinical TNM staging were analyzed in ESCC patients (A). The correlations between TUSC3 expressions and the different T stages (B) and N stages(C) were analyzed. Differentiated degrees(D) and mass location(E) were analyzed in ESCC. The Spearman correlation method was used to evaluate the association of scores.

