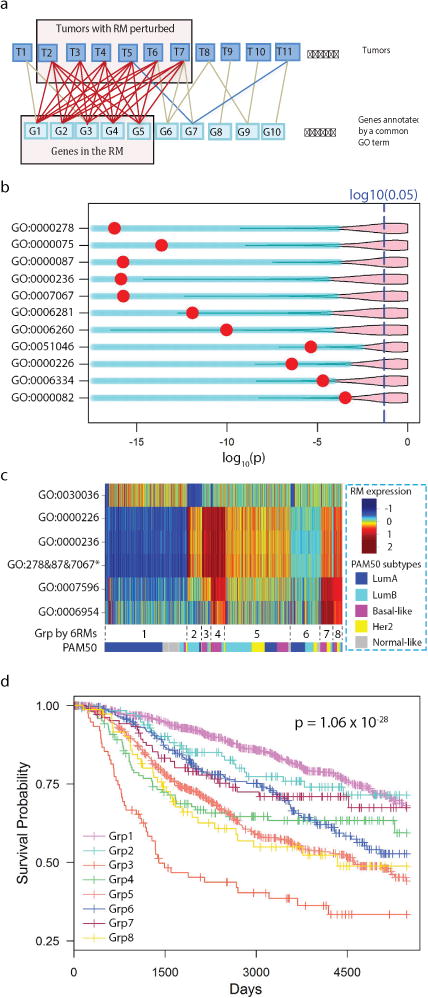
Figure 1. Identification of response modules predictive of clinical outcomes.

a) Diagram illustrating the search for a response module by finding a densely connected bipartite graph. Tumors and DEGs annotated by a common GO term are represented as the nodes in the graph. An edge indicates that a gene is differentially expressed in a tumor. A response module consists of a set of co-differentially expressed genes in multiple tumors satisfying a specified connectivity. b) A volcano plot illustrating response modules that are predictive of patient outcomes. A row corresponds to a response module, and a red dot indicates the Kaplan-Meier p-value of METABRIC patients dichotomized according to the state of the response module. The pink area indicates the upper 95% of p-values that can be obtained when dividing patients conditioning on randomly drawn gene sets of the same size as the corresponding response module. c) A heat map illustrating the averaged within-module expression values of response modules (response modules annotated with GO:0000278, GO:0000087, and GO:0007067 are merged and indicated by an asterisk). The pseudo-color represents the relative expression value of a response module in tumors by the number of standard deviations from the mean. The tumors were clustered into subgroups with group IDs indicated below the heat map; the proportion of tumors belonging to PAM50 subtypes within a cluster are shown as colors. d) Kaplan-Meier survival curves of the 8 patient groups identified by clustering analysis.
