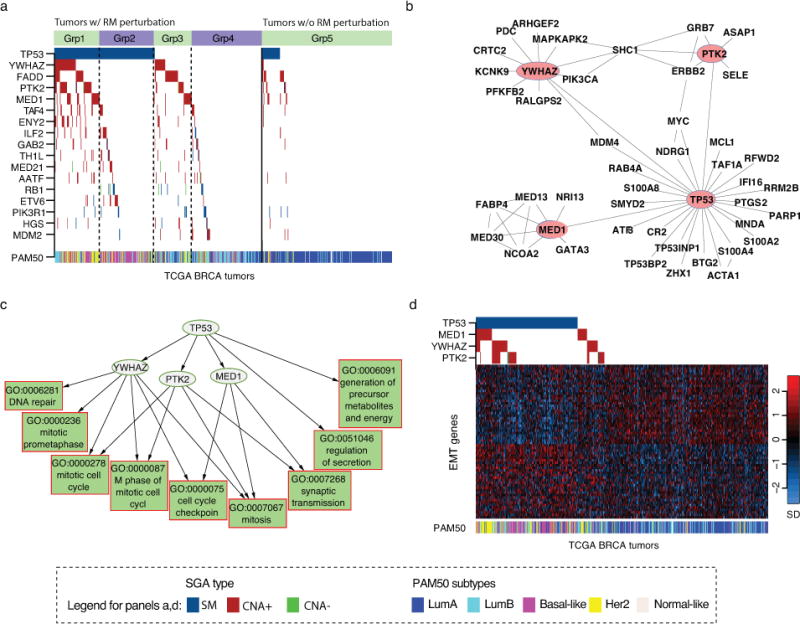
Figure 2. TPYM encodes a common set of signals.

a) The distribution patterns of SGAs significantly associated with the expression state of the mitosis response module (GO:0007067). Tumors are on the x-axis, and SGA-perturbed genes are along the y-axis. A color-coded box indicates the tumors in which a gene is altered. The solid line separates the tumors with the response module aberrantly expressed (left) from those with normal expression (right). Dotted lines separate tumors into subsets with different combinations of TPYM alterations. b) PPI interaction between TPYM and their close neighbors. c) The relationships between TPYM alterations and their target response modules are organized as a directed acyclic graph. d) The expression status of EMT signature genes and the SGA status of TPYM. TCGA breast cancers are arranged along the x-axis, and EMT signature genes are arranged along the y-axis. The expression value of a gene is normalized to have a mean of 0 and unit standard deviation, and the pseudo-color is mapped to the range covering 90% of the tumors. PAM50 classifications of the tumors are shown as a color bar below.
