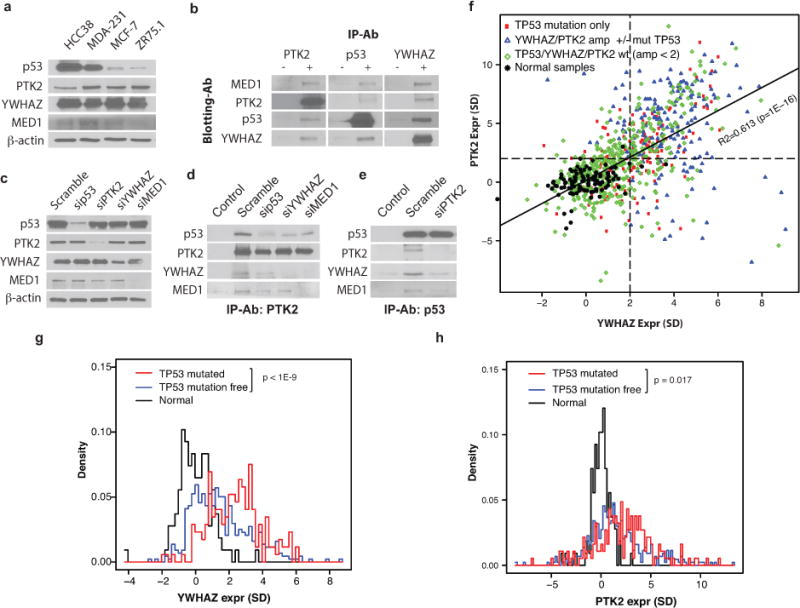
Figure 3. P53, PTK2, YWHAZ, and MED1 form a protein complex.

a) Baseline protein expression of TPYM proteins in different cell lines. b) Co-IP of the four proteins. Results are organized according to antibody for Co-IP (“−” denotes control IgG, “+” indicates specific antibody) and antibody for Western blot (rows). c) Western blot showing the impact of siRNA treatments on the expression of the four proteins. d – e) The impact of depleting member proteins of the tetramer complex. f) Scatter plot of PTK2 (y-axis) and YWHAZ (x-axis) expression in tumors. Each point represents a tumor, and its genomic status of TP53, PTK2, and YWHAZ are indicated by color and shape. Samples are normalized according to the mean and standard deviation (SD) of normal breast samples; the unit of axis represents the number of SDs from the mean of the normal samples for the corresponding genes. The dashed lines indicate 2 SDs above the mean of the normal samples for PTK2 and YWHAZ respectively. The solid line is the regression line with R-squared and p-values shown. g – h) Histograms of normal samples (black), tumor samples without SGAs affecting TP53, PTK2, or YWHAZ (blue), and tumor samples with TP53 mutation but normal status for PTK2 and YWHAZ (red). The P-values for the contrasts between TP53 mutant tumors and those from the tumors without SGAs are shown.
