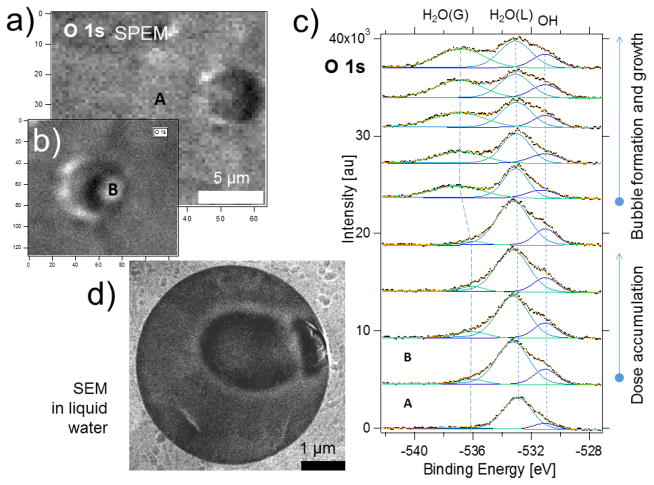
Fig. 11.
(a) and (b) O1s maps of the water taken through a graphene covered orifice before (a) and after (b) spectra acquisition at the point B; The characteristic “shadow” on the left side of the feature B (panel b) is a manifestation of the membrane topography change; (c) bottom-up sequential O 1s spectra taken from the location B showing the temporal evolution of liquid (L) and vapor (G) components of water; for the sake of comparison the spectrum A recorded on the graphene covered support outside the membrane is displayed (point A in the left upper panel). e) Liquid SEM images of the electron beam-induced gas bubble formation. Adapted from ref [33].

