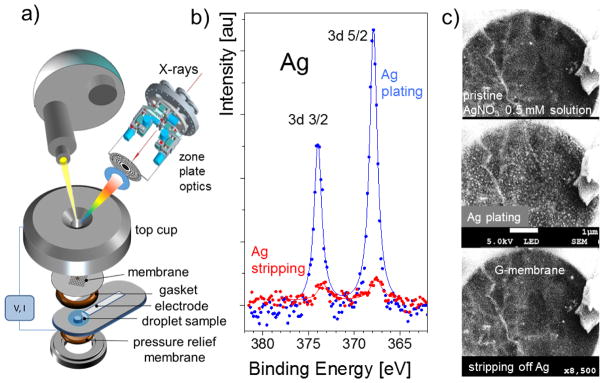
Fig. 12.
a) Design of an electrochemical cell with an electron transparent graphene window; b) Ag 3d spectra recorded at the graphene membrane/AgNO3 interface at two different potentials between working (graphene) and counter (Ag) electrodes. The top spectrum (blue) corresponds to the plating reaction while the bottom one (red) corresponds to the Ag stripping; c) the concomitant liquid SEM studies of the same reaction in the same setup. The top panel is the initial state of the graphene electrode before applying potential. The middle and bottom panels show the data for applied potentials of +3 V and − 3V, respectively, to the Ag counter-electrode.

