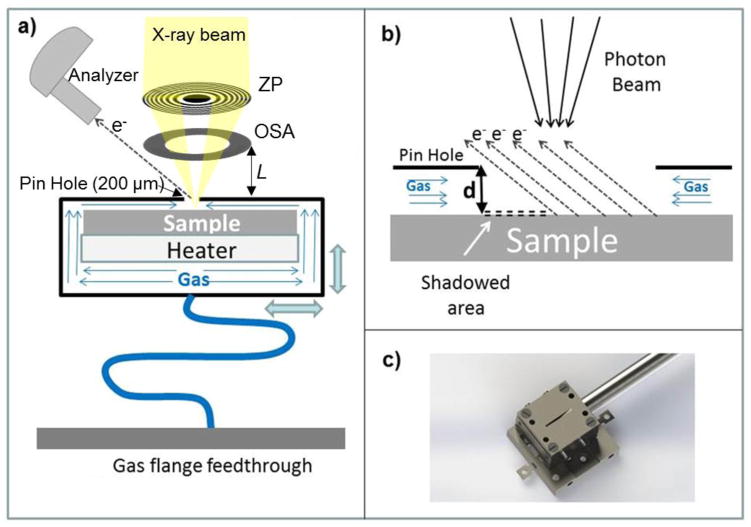
Fig. 3.
(a) Sketch of the SPEM set-up with the reaction cell and its main components. (b) Large scale sketch illustrating the probe-sample area. In order to illustrate the shadowing effect, the distance d is expanded. (c) Photo of the cell mounted on the sample holder which can be inserted in the scanning unit of the SPEM.

