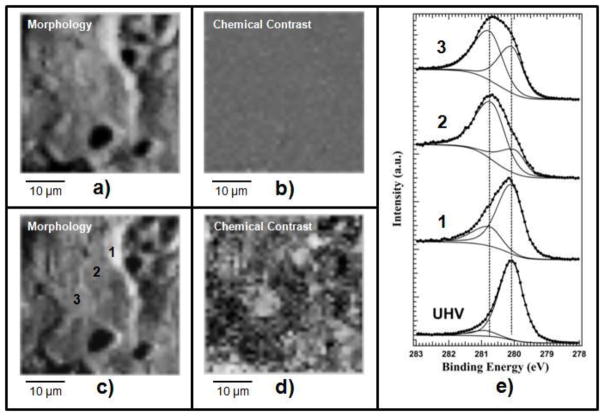
Fig. 6.
(a) and (c) Raw Ru images of clean and oxidized surface, respectively, measured with the analyzer tuned to the Ru 3d5/2 energy window, where the topography obscures the chemical contrast. (b) and (c) Ru chemical images obtained after removal of the topography contribution from (a) and (c), respectively. (e) Ru 3d5/2 spectra taken before (UHV) and after oxidation in different positions 1, 2, 3, as indicated in image (c). Oxidation conditions: pulse duration 3.2 ms, repetition rate of 0.35 Hz and O2 pressure behind the valve of 350 kPa. The data acquired from the oxidized surface were taken after 600 pulse shots.

