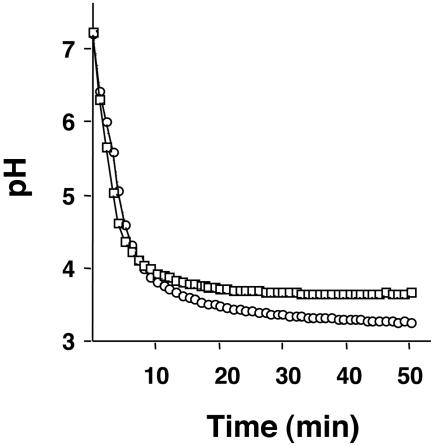
FIG. 2.
Glycolytic pH profile of S. sobrinus 6715. Cells were collected from a steady-state chemostat held at pH 7.0 (squares) or 5.0 (circles), washed once with ice-cold water, and resuspended in a 50 mM KCl/1 mM MgCl2 solution. Glucose was added to the cell suspension to initiate glycolysis, and pH drops were continuously monitored for 50 min. Data points were collected every 10 s, and data for every 2 min 30 s are presented. The graph shown is a representative of five independent experiments.

