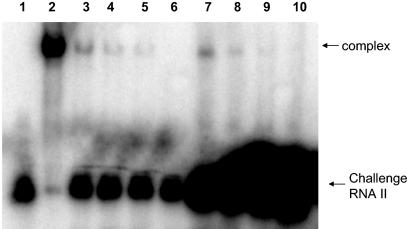
FIG. 5.
Dissociation of RNA I-RNA II complex in vitro. In vitro-produced RNA I and RNA II were allowed to form complexes at various ratios. The preformed complexes were then challenged with a 10-fold (lanes 3 to 6) or 100-fold (lanes 7 to 10) molar excess of labeled RNA II relative to RNA I. Lane 1, labeled RNA II; lane 2, labeled RNA II with unlabeled RNA I at a 1:1 ratio; lanes 3 to 6, unlabeled preformed RNA I-RNA II complex at 1:1, 1:2.5, 1:5, and 1:10 ratios, respectively, challenged with a 10-fold molar excess of labeled RNA II relative to RNA I; lanes 7 to 10, unlabeled preformed RNA I-RNA II complex at 1:1, 1:2.5, 1:5, and 1:10 ratios, respectively, challenged with 100-fold molar excess of labeled RNA II relative to RNA I. The large black spot at the bottom of lanes 7 to 10 is due to the 10-fold-larger amounts of labeled challenge RNA II used in these assays than in those shown in lanes 3 to 6. Counts from the shifted bands as determined by ImageQuant software are as follows: lane 3, 518,812; lane 4, 110,869; lane 5, 47,118; lane 7, 422,190; lane 8, 132,348; lane 9, 51,742.

