
Figure 4.
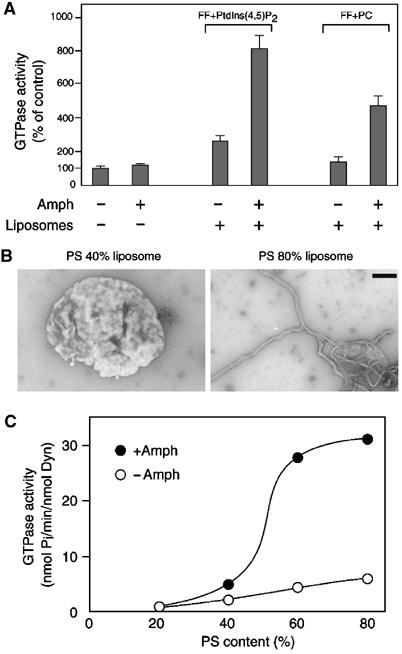
Effect of the lipid composition on stimulation of dynamin GTPase activity by amphiphysin 1. (A) Dynamin GTPase activity measured with or without amphiphysin 1, and in the absence or presence of liposomes. The lipid composition of FF+PtdIns(4,5)P2 and FF+PC liposomes are cholesterol/FF/PtdIns(4,5)P2=20:74:6% (w/w) and cholesterol/FF/PC=20:74:6% (w/w), respectively. Results were normalized to the average of control value (1.06 nmol Pi/min/nmol Dyn). (B) Negative-staining electron micrographs of liposomes incubated with amphiphysin 1. Left, a single liposome containing 40% PS (cholesterol/PS/PC=20:40:40%, w/w) generated irregular surface, but little tubulation was observed. Right, a single liposome containing 80% PS (cholesterol/PS=20:80%, w/w) formed massive tubules. Bar=500 nm. (C) Dynamin GTPase activity measured with (closed circles) or without (open circles) amphiphysin 1, in the presence of liposomes containing various amounts of PS, PC and 20% cholesterol. Data represent the mean value of triplicate measurements.