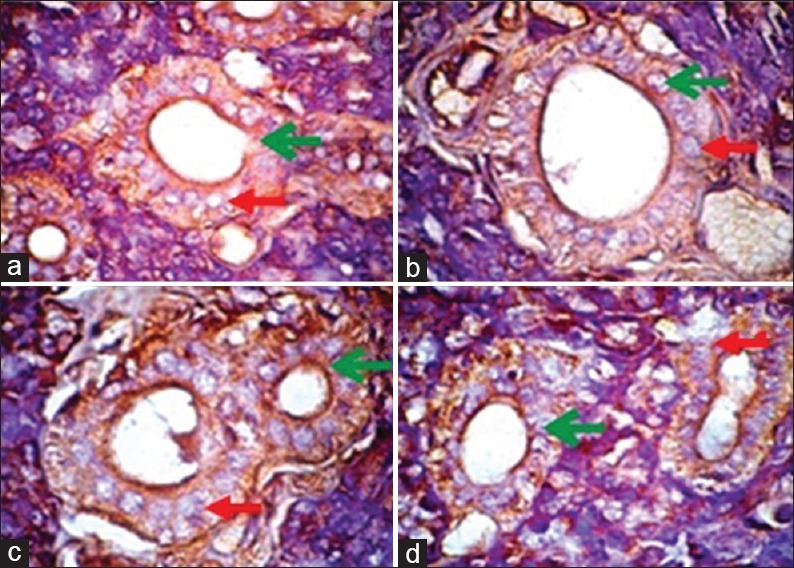
Figure 3.

Results of immunohistochemical examination showing beta defensin-2 expression in the epithelial parotid gland in each group magnified (×1000). Green arrow showing cells expressing beta defensin-2. Red arrow showing cells that do not express beta defensin-2. Description: (a) Negative control, (b) positive control, (c) treatment Group 1 (P. 1), (d) treatment Group 2 (P. 2)
