
Figure 2.
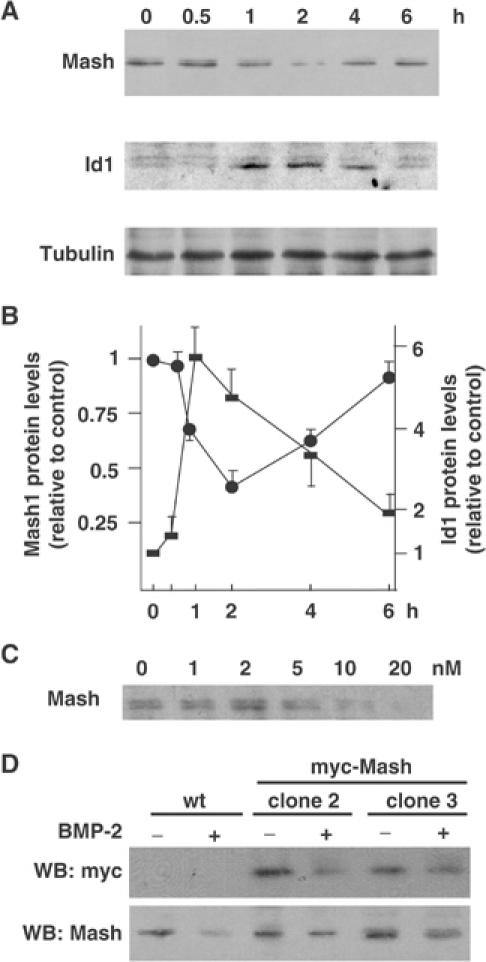
(A) Cell extracts were obtained from DMS53 cells treated with 5 nM BMP-2 for the times indicated and analyzed by immunoblotting. (B) Quantifications of Mash1 (filled circles) and Id1 (filled squares) protein levels from five separate assays were performed using α-tubulin as normalization and were expressed as fold-change over control samples at time zero and expressed as mean±s.e.m. (C) DMS53 cells were treated for 2 h with the indicated amounts of BMP-2 and Mash1 expression was analyzed by immunoblotting. (D) Parental and two independent myc-Mash1 overexpressing clones were treated for 2 h with 5 nM BMP-2 and expressions of ectopic Mash1 (upper panel) or endogenous Mash1 (lower panel) were analyzed by immunoblotting.