
Figure 1.
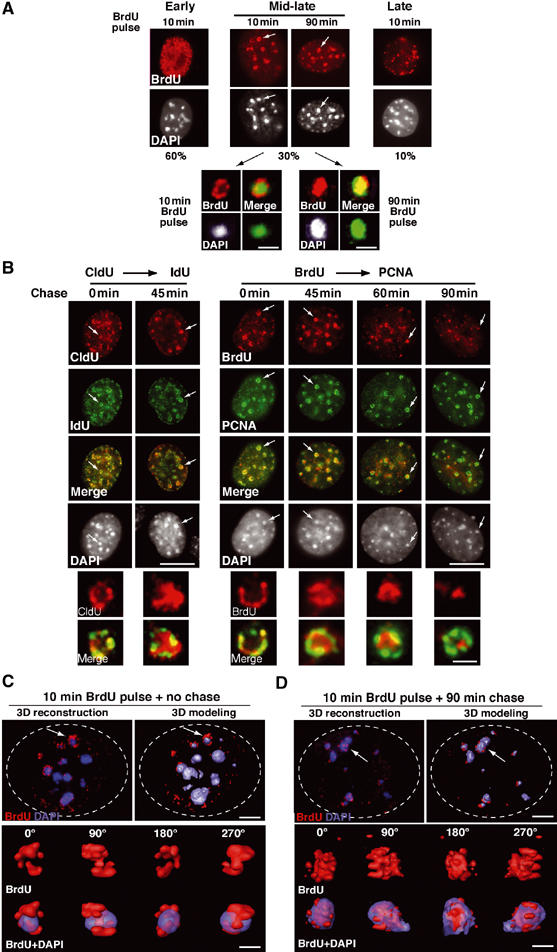
Specific dynamics of DNA synthesis in replicating pericentric heterochromatin. (A) Typical BrdU-labeled S-phase patterns. Top: 3T3 cells were pulsed for 10 or 90 min with BrdU (red, top) and stained with DAPI (bottom). Scale bar, 10 μm. Bottom: Magnification (six-fold) of individual replicating pericentric heterochromatin domain indicated by arrows on top. Corresponding BrdU (red), DAPI, and merge images are presented. In merge, DAPI was pseudocolored in green. Scale bar, 0.5 μm. (B) Newly replicated DNA is located at the periphery of the DAPI dense region and then becomes internalized. Left: Pulse–chase–pulse on 3T3 cells with first a CldU pulse followed by 45 min chase before a second IdU pulse was given, or both CldU and IdU were added together (0 min). Representative images (CldU, red; IdU, green) are shown with merge and DAPI staining. Right: 3T3 cells pulsed for 10 min with BrdU were chased for various times as indicated. Typical BrdU (red) and PCNA (green) patterns with merge and their corresponding DAPI staining are presented. Scale bar, 10 μm. The arrows point to the pericentric heterochromatin domain magnified six-fold below. Scale bar, 0.5 μm. (C) 3D reconstruction and modeling of DNA synthesis at pericentric heterochromatin domains. 3T3 cell were pulse labeled with BrdU for 10 min, and after immuno- and DAPI staining, z stack images of a single 3T3 cell nucleus in mid-late S-phase were used for 3D reconstruction and modeling. Localization of BrdU incorporation (red) and DNA (blue) in the whole nucleus. The dashed line represents the periphery of the nucleus. The arrow indicates the heterochromatin domain selected for magnification below. Scale bar, 10 μm. Several rotation angles are presented and ongoing DNA synthesis (red) is shown with DAPI staining (transparent blue). Scale bar, 0.5 μm. (D) As above, for 90 min chase.