
Figure 6.
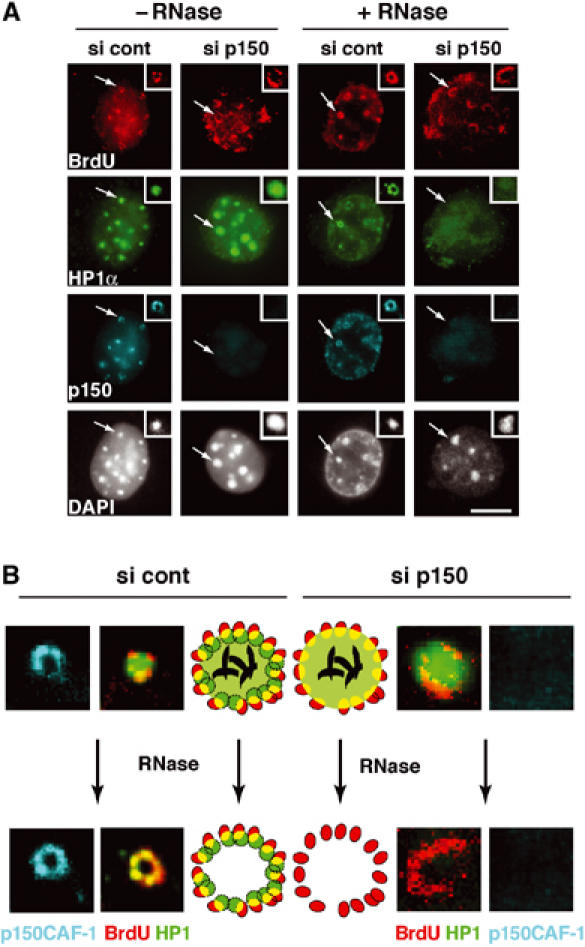
p150CAF-1 knock-down leads to a loss of HP1α at mid-late replication foci. (A) A concordant loss of p150CAF-1 at mid-late S-phase and the HP1 RNase-resistant fraction. Triple immunofluorescence labelings with BrdU (red, 10 min pulse), p150CAF-1 (green), and HP1α (blue) are shown for control or p150CAF-1 siRNA-treated 3T3 cells. Cells with mid-late S-phase profiles for various conditions are shown: nontreated (−RNase, left) or treated by RNase (+RNase, right). The arrow indicates a spot shown at a three-fold magnification in insets. Corresponding DAPI stainings are shown. Scale bar, 10 μm. (B) Model for the role of p150CAF-1 and HP1 localization at sites of DNA synthesis during replication of pericentromeric heterochromatin in mid-late S-phase. Left: In the presence of p150CAF-1 (si cont), replicating pericentric heterochromatin is represented with a replication-independent pool of HP1 (RI-HP1, large light green circle) in the inner region interacting with RNA (black), and a replication-specific pool of HP1 at the periphery (RS-HP1, small dashed green circles) colocalizing with p150CAF-1 (red circles). Colocalization of DNA synthesis and RS-HP1 is represented in yellow. Upon RNase treatment, the RI-HP1 in the inner part is removed following RNA degradation without affecting the RS-HP1 at the periphery. Right: In the absence of p150CAF-1 (si p150), the RS-HP1 (small dashed green circles) at the periphery is lost whereas the RI-HP1 (large light green circle) maintained by RNA (black) remains. Upon RNase treatment, all HP1 is thus lost. Corresponding magnified images from insets of (A) are shown. Stainings are p150CAF-1 (blue), and a merged image of HP1α (green) and BrdU (red).