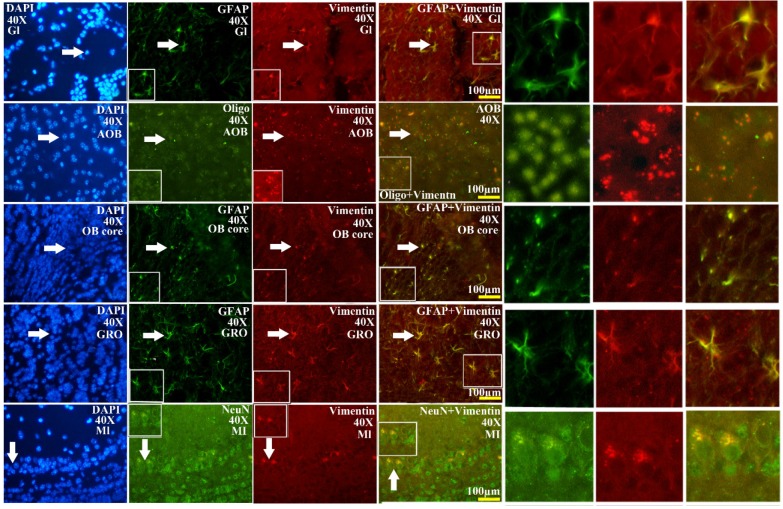
Figure 4.
The representative images amplified by 40 times of vimentin positive cells distribution in the different regions and neural cells of OB in the SOD1 wild-type mice. The rank order of VCCs density in the entire OB was AOB>OB core>GRO>Gl>MI>the others. Almost all VCCs in the Gl, OB core and GRO were the astrocyte cell. Almost all NPCs in the AOB were the oligodendrocyte cell. The fewer NPCs in MI and IPL (No image) were the neuron cells. The white arrow indicated the positive cell.

