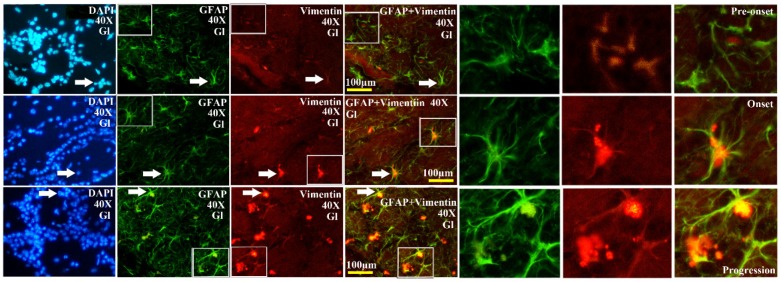
Figure 6.
The representative images amplified by 40 times of vimentin positive cells distribution in the Gl of OB at the pre-onset, onset and progression stages of the SOD1 G93A transgenic mice. The amount of vimentin positive cells gradually increased from the pre-onset to onset to progression stages in the SOD1 G93A transgenic mice. The most significant increase stage of vimentin positive cells was at the progression stage. Almost increased vimentin positive cells were the astrocyte cell.

