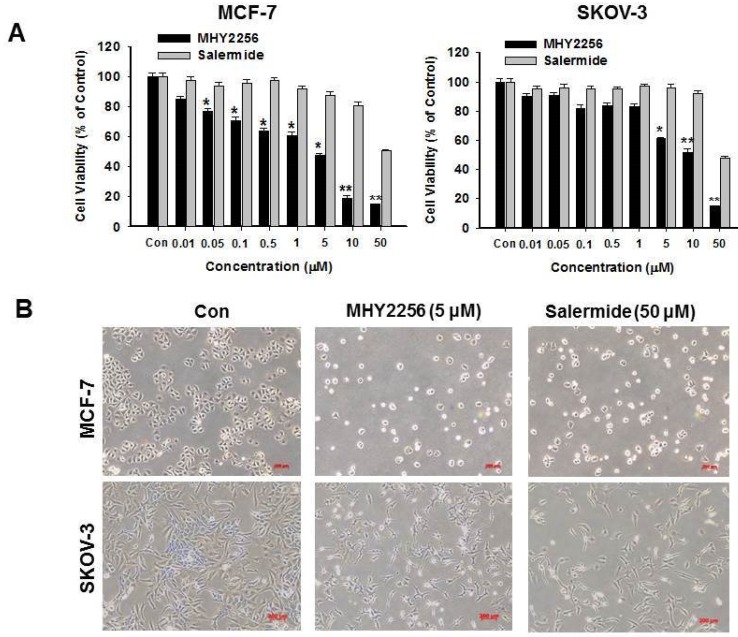
Figure 3.
Effects of MHY2256 and salermide on cell viability. (A) The cells were treated with MHY2256 and salermide at various concentrations (0.1-50 μM) for 48 h. Viable cells were detected using MTT assay, and viability was determined as the ratio between treated cells and untreated controls. Data are presented as the mean ± SEM of three independent experiments. Statistical analysis was performed using one-way analysis of the variance (ANOVA) followed by Bonferroni's multiple comparison test. *p<0.05, **p <0.01 indicate significant differences between control and treatment groups. (B) Morphological changes in human cancer cells after MHY2256 and salermide treatment. MCF-7 and SKOV-3 cells were incubated for 48 h with the indicated drug concentrations and the cell morphology was examined microscopically (Magnification x100).

