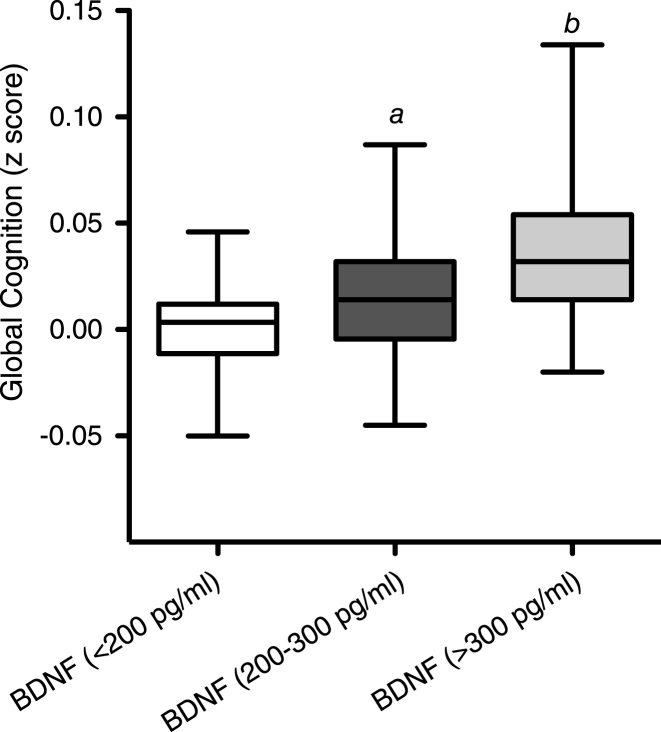
Fig.4.
A) The relationship between Cognitive score (z-score) in 3 dietary groups over the period of 12 weeks. B) The relationship between BDNF level and z-score (cognitive score) Each point represents a dietary group at a specific visit and is an average of their z score and BDNF level for each. Hence there are 12 points.

