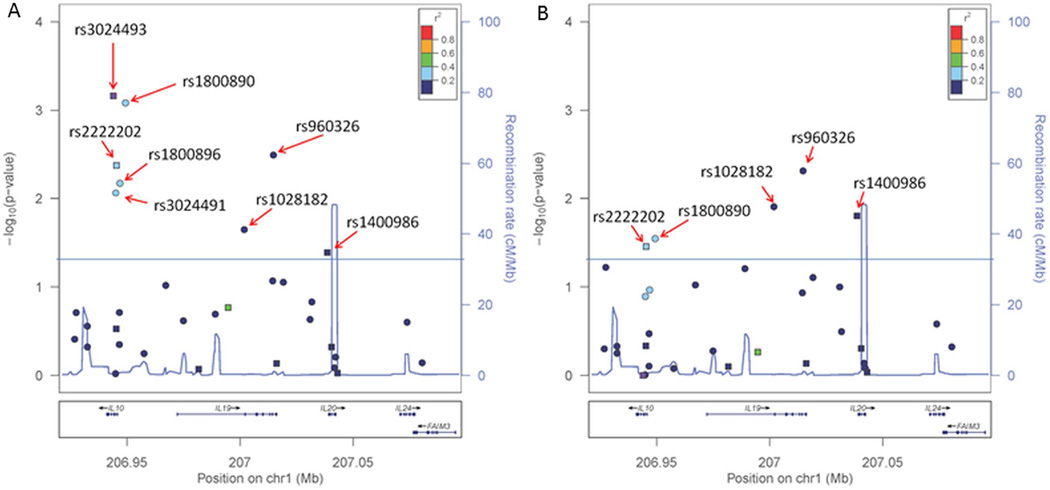
Figure 1.
Fine mapping association analysis of 1q32.1 with melanoma overall survival. Twenty-four SNPs were selected from 1KGP and HapMap phase 3 with correlation of r2 < 0.6. The SNP associations with melanoma survival were tested individually for each variant using Cox regression models (Materials and methods) in multivariate analysis adjusted by age at diagnosis, gender, tumour stage, thickness, ulceration, and histological subtype. p Values were determined using 2 degrees of freedom test. (A) SNP-unadjusted analysis. (B) Analysis adjusted by the status of rs3024493. Circular markers represent SNPs chosen for fine mapping and square markers were part of the original tagging selection; the colour of the markers indicates the linkage disequilibrium (LD) correlation (r2) in relation to rs3024493, as displayed by legend in the upper right section of each plot.

