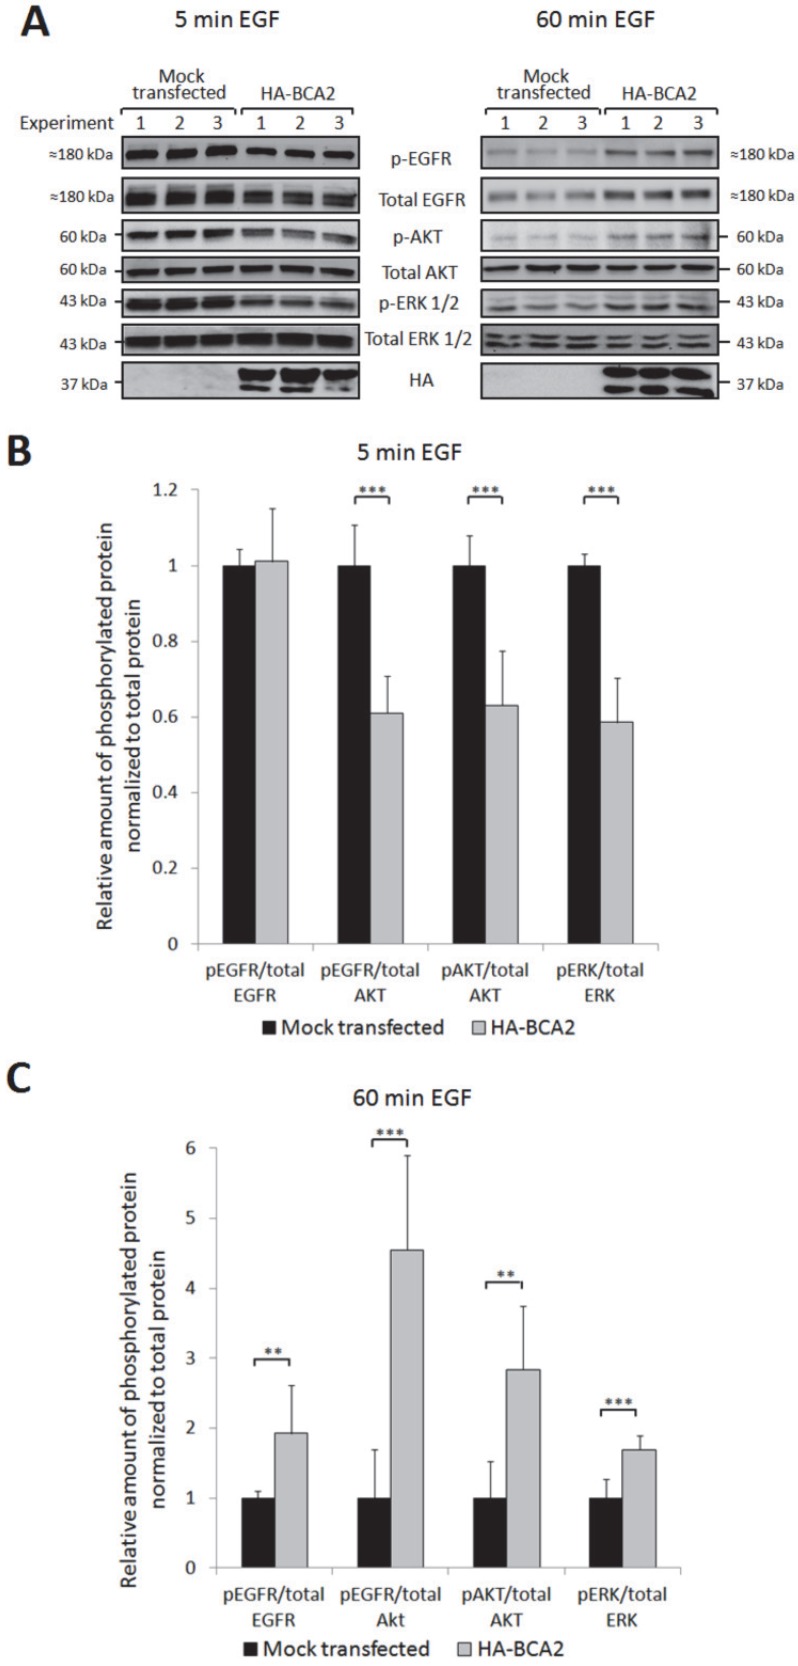
Figure 6.
EGFR activation and signalling in HA-BCA2 over-expressing HeLa cells following. HA-BCA2 and mock transfected cells were serum starved for 60 min then stimulated with 20 ng/mL EGF for 5 or 60 min. Cell lysates were collected from three independent experiments. A) Western blotting was performed for EGFR, pEGFR (Tyr1068), AKT (Ser473), pAKT, ERK, pERK (Thr202/Tyr204) and HA. Band intensities were quantified using ImageJ software and are presented as the amount of pEGFR normalized to total EGFR, amount of pEGFR normalized to total AKT, amount of pAKT normalized to total AKT and amount of pERK normalized to total ERK. B) Relative amount of phosphorylated proteins at 5 min. C) Relative amount of phosphorylated proteins at 60 min. Error bars represent 95% confidence intervals. ** p ≤ 0.01. *** p ≤ 0.001.

