. 2016 Aug 17;12(38):7953–7958. doi: 10.1039/c6sm01106c

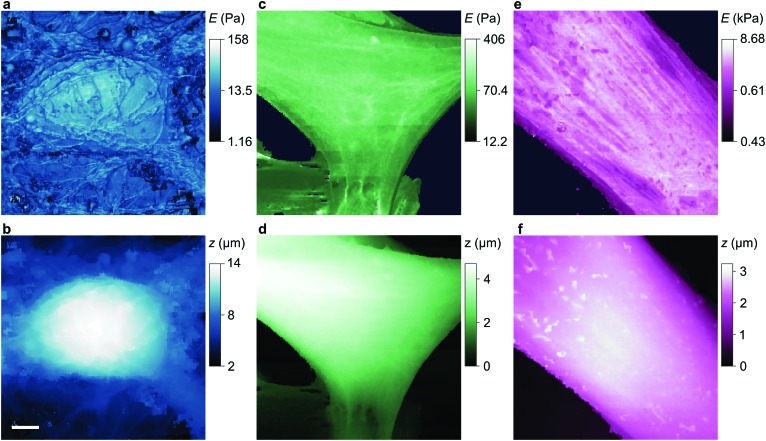
Fig. 3. Stiffness and topography of three cell types imaged at high resolution by nanopipet ICM. (a and b) HN neuron mapped by a 110 nm aperture nanopipet at ΔI = 0.3%, 2% exerting stress of 0.29 Pa, 0.96 Pa at tip-cell gaps of 90 nm, 60 nm that typically push the cell soma 0.1–0.2 μm. (c and d) HpL cell mapped by a 52 nm aperture nanopipet at ΔI = 0.6%, 3% exerting stress of 4.27 Pa, 13.26 Pa at gaps of 37 nm, 25 nm. (e and f) HMF fibroblast mapped by a 100 nm aperture nanopipet at ΔI = 0.3%, 3% exerting stress of 0.4 Pa, 122.5 Pa at gaps of 81 nm, 49 nm, resolving the stiffness of stress fibres. The substrate stiffness is masked out in dark blue. The lateral scale bar is 4 μm.

Fig. 3