
Fig. 3.
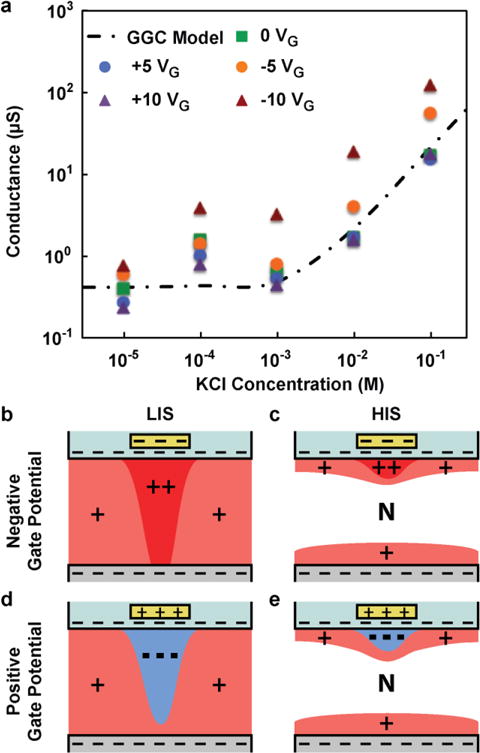
(a) Nanochannel conductance as function of KCl concentration for various gate voltages (symbols) and the Geometry-Governed-Conductance (GGC) model (dashed line). (b–e) Illustration of ions rearrangement for both negative (b,c) and positive (d,e) gate potential at low (b,d) and high (c,e) ionic strength (LIS and HIS respectively). N represents the neutral region.