
Fig. 4.
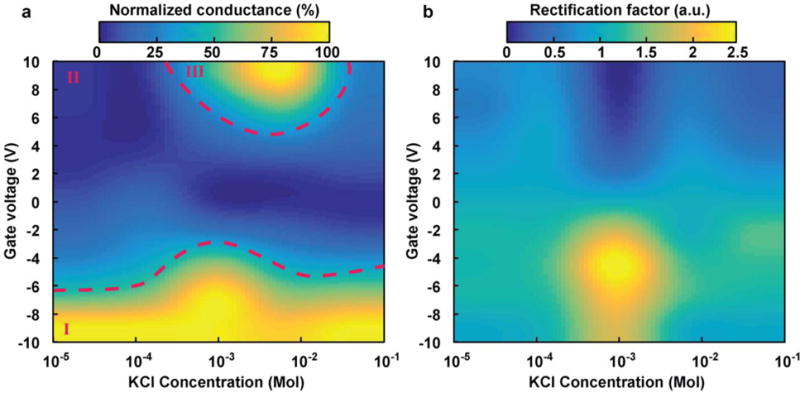
Heat maps to graphically represent (a) normalized conductance and (b) rectification at various gate voltages and KCl concentrations for a silicon membrane employing 50 nm nanochannels.
Official websites use .gov
A
.gov website belongs to an official
government organization in the United States.
Secure .gov websites use HTTPS
A lock (
) or https:// means you've safely
connected to the .gov website. Share sensitive
information only on official, secure websites.
Heat maps to graphically represent (a) normalized conductance and (b) rectification at various gate voltages and KCl concentrations for a silicon membrane employing 50 nm nanochannels.