
Figure 4.
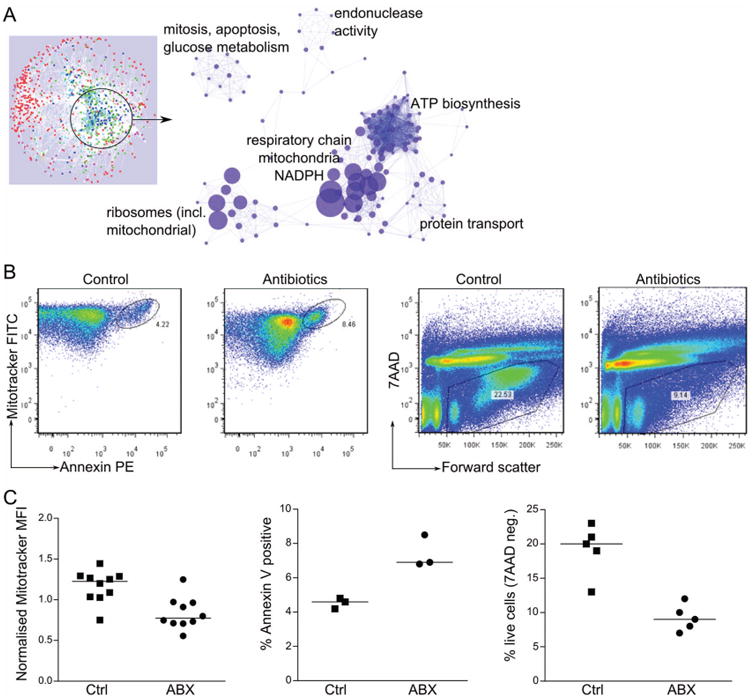
Effects of ABx and of ABx-resistant microbes on the host: (A) gene ontology categories over-represented in the genes of the subnetwork directly affected by ABx and by ABx-resistant microbiota. Size of the symbol represents enrichment fold; only most enriched categories are indicated. See also online supplementary figure S6; (B and C) mitochondrial staining (Mitotracker MFI normalised to the average MFI for each experiment), apoptosis (Annexin V) and cell viability (7AAD), in gut epithelial cells isolated from ABx-treated and control mice; (B) a single representative experiment; (C) summary graphs of 3–5 experiments; each symbol represents one mouse; median values are represented by horizontal lines; all comparisons significant at p<0.01. Ctrl, control; ABx, antibiotic-treated; MFI, mean fluorescent intensity.