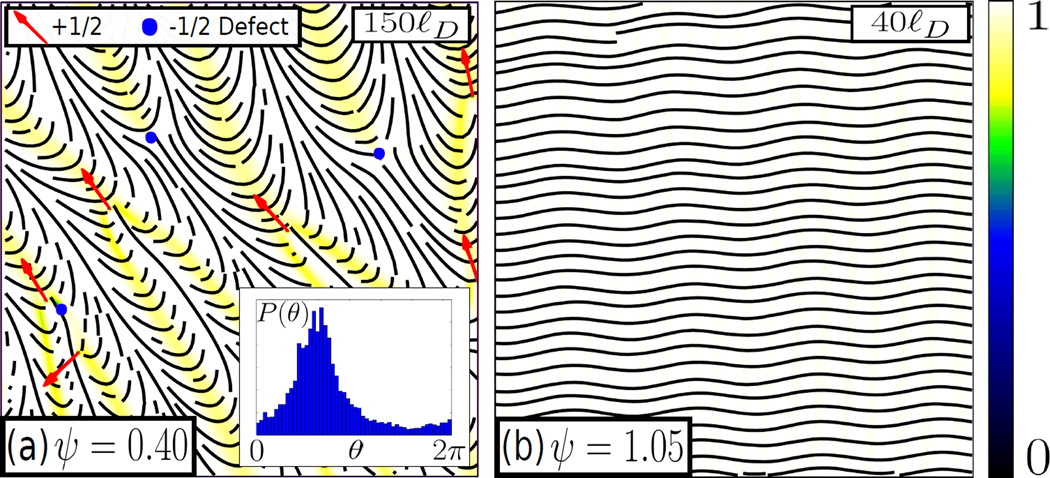
Fig. 1.
Heatmaps of the degree of order (S/S0, colorbar on the right) showing the nonequilibrium steady-states. (a) The defect-ordered state, with a histogram inset showing the sharp polar ordering in the orientation of defects. The lines, showing the direction of order, highlight the extended trails left by the motion of these defects. (b) The undulating nematic state is highly ordered (S ≃ S0) but the direction of order undulates. Scale bars are in the top right corners.

