
Figure 5.
Morphological Analysis Demonstrating Impaired Cardiac Function of flncb+p53 MO-Injected Zebrafish Embryos
High-speed videos of hearts in 48 hpf embryos were analyzed using custom MATLAB software (Mathworks, Natick, Massachusetts) 23, 24. Embryos injected with flnc+p53 MO (n = 21) were compared with uninjected control embryos (n = 17) and control embryos injected with a scrambled MO (25-N+p53 MO; n = 11). (A) Mean reverse flow fraction (±SE) for each treatment (uninjected: 0.017, 25-N+p53 MO: 0.008, flncb+p53 MO: 0.061). Significant differences were observed for flncb+p53 MO-injected relative to control embryos by analysis of variance (ANOVA) (p = 6.1 × 10⁻⁵). Follow-up Tukey tests indicated differences between flncb+p53 MO and uninjected embryos (p = 0.023); and flncb+p53 MO compared with 25-N+p53 MO (p = 0.007), but no difference between the control embryos (p = 0.420). (B) Mean heart rate (±SE) for each treatment (uninjected: 193.5 beats/min [bpm], 25-N+p53 MO: 181.0 bpm, flncb+p53 MO: 162.0 bpm (ANOVA; p = 2.1 × 10⁻⁷). flncb+p53 MO decreased the heart rate at 48 hpf compared with both uninjected embryos and 25-N+p53 MO-injected embryos. (***p = 0.001, ***p = 0.005, respectively, by Tukey Test); heart rates of uninjected versus 25-N+p53 MO were not different (p = 0.118). (C) Mean stroke volume (±SE) for each treatment (uninjected: 0.125 nl, 25-N+p53 MO: 0.185 nl, flncb+p53 MO: 0.100 nl). No significant difference was detected between treatments (Kruskal-Wallis 1-way ANOVA on ranks; p = 0.482). (D) Mean cardiac output (±SE) for each treatment (uninjected: 24.4 nl/min, 25-N+p53 MO: 32.6 nl/min, flncb+p53 MO: 16.0 nl/min). No significant difference was detected between treatments (Kruskal-Wallis 1-way ANOVA on ranks; p = 0.293). For Videos 1, 2, and 3, please see the online version of this article. Abbreviations as in Figure 4.

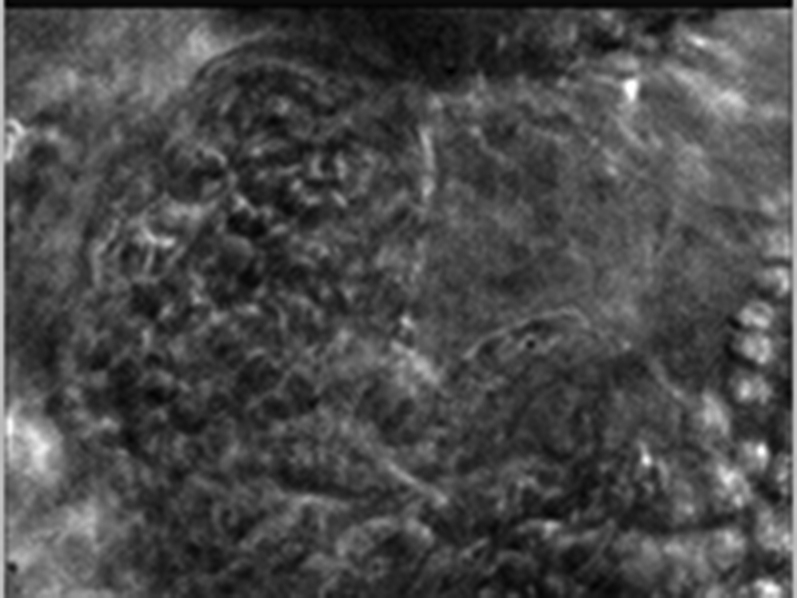
Ventral view of an uninjected control zebrafish heart at 48 hours post-fertilization.
For online presentation, these supplemental videos have been reduced in resolution and modified to read at 30 frames per second.
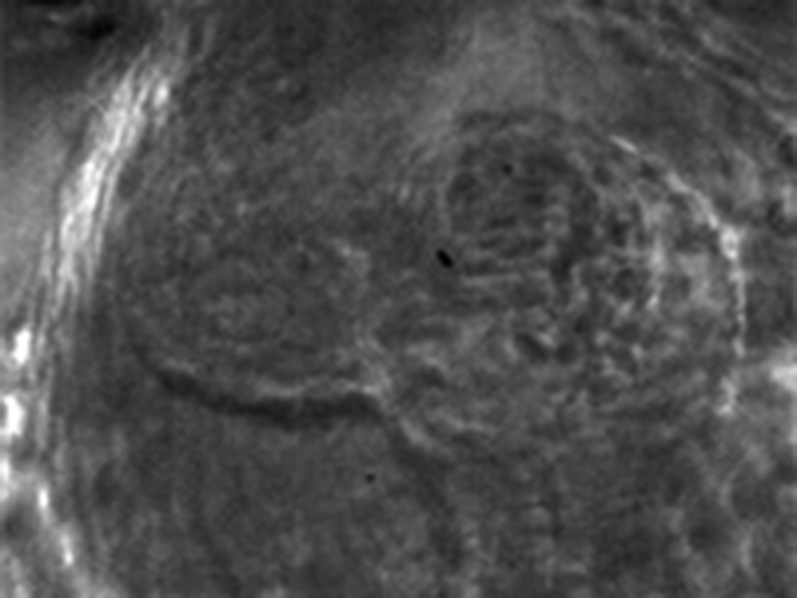
Ventral view of a 25N-MO control zebrafish heart at 48 hours post-fertilization.
For online presentation, these supplemental videos have been reduced in resolution and modified to read at 30 frames per second.
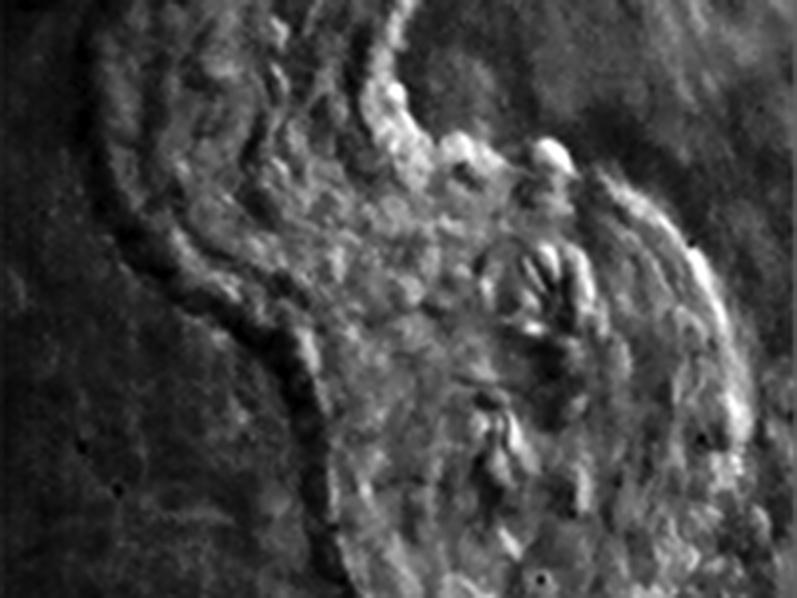
Ventral view of a representative flncb MO zebrafish heart at 48 hours post-fertilization.
Note the increased fraction of retrograde flow through the atrioventricular junction. For online presentation, these supplemental videos have been reduced in resolution and modified to read at 30 frames per second.