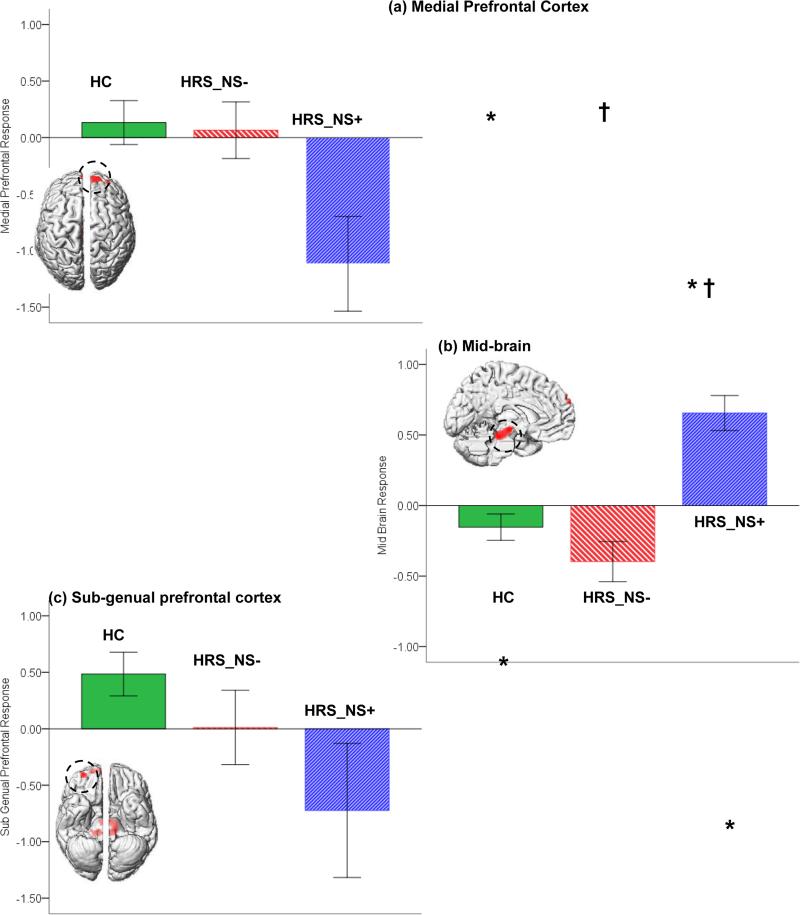
Figure 2.
Significant clusters under the overall main effect of group are depicted for responses to positively valenced stimuli. Clusters are projected to the dorsal surface for the medial prefrontal cortex (a), the medial surface for the mid-brain (b) and the ventral surface for the sub-genual prefrontal cortex (c)(see Table 1 for significance). Adjoining graphs depict estimated BOLD (% signal change) under the clusters of significance for each of the groups and each of the main effects (error bars are ± sem). As indicated, significant effects were observed in analyses of signal change data (See Results). Post-hoc comparisons (Sidak, 1967)(p<.05) revealed significant differences between HRS_NS+ and HC (mPFC, mid-brain and sgPFC; * in the Figure) and HRS_NS+ and HRS_NS− (mPFC and mid-brain; † in the Figure).

