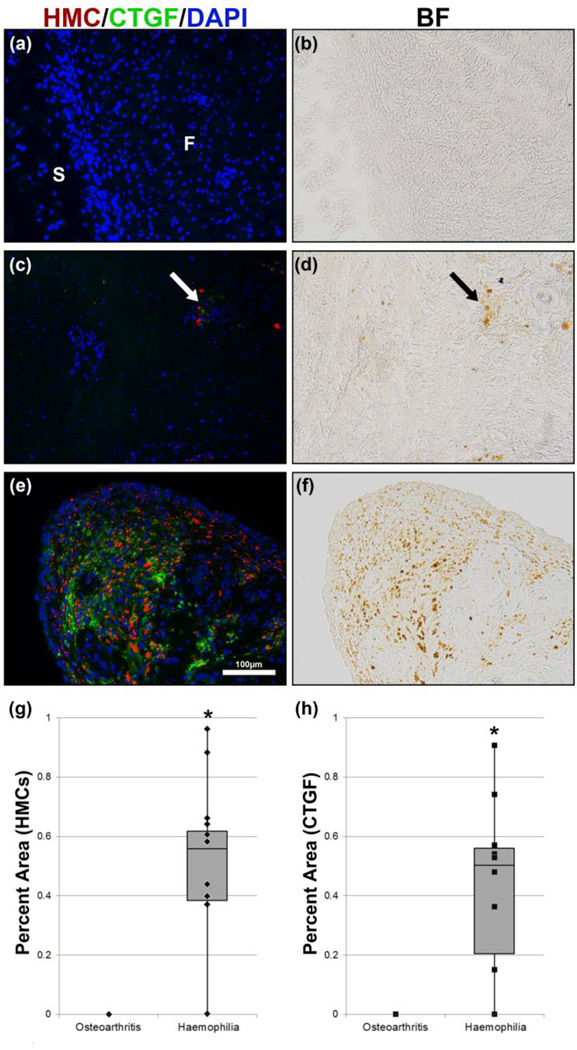
Figure 3.
CTGF immunostain of synovial tissue in osteoarthritis patient (a) and haemophilia patients (c & e). Bright-field images (b, d & f) showing the presence of HMCs that correspond to CTGF IHC (a, c & e) respectively. CTGF (green) was mainly observed at or adjacent to the brown HMCs (arrow) in both the fibrous sub-surface (c) and surface layer (e) of synovial membrane in haemophilia patients only. Quantification of the per cent area of HMCs (g) and CTGF-positive (h) staining showed a significant increase in PWH (n = 10) compared to osteoarthritis patients (n = 10), *P < 0.001. BF: bright field; F: fibrous sub-surface layer; S: synovium.

