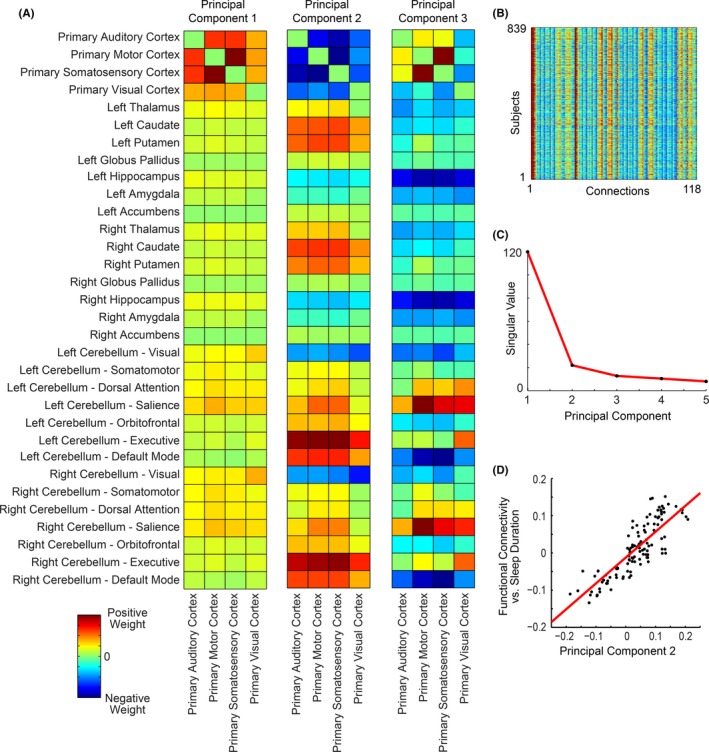
Figure 4.

Principal components of intersubject variance in functional connectivity. (A) The first three principal components are shown representing subject by connection singular vectors. (B) Matrix of 839 subjects × 118 connections used to obtain principal components. (C) Singular values of first five components. (D) Comparison of principal component 2 with relationship of sleep duration and functional connectivity for the same connections
