
Figure 2.
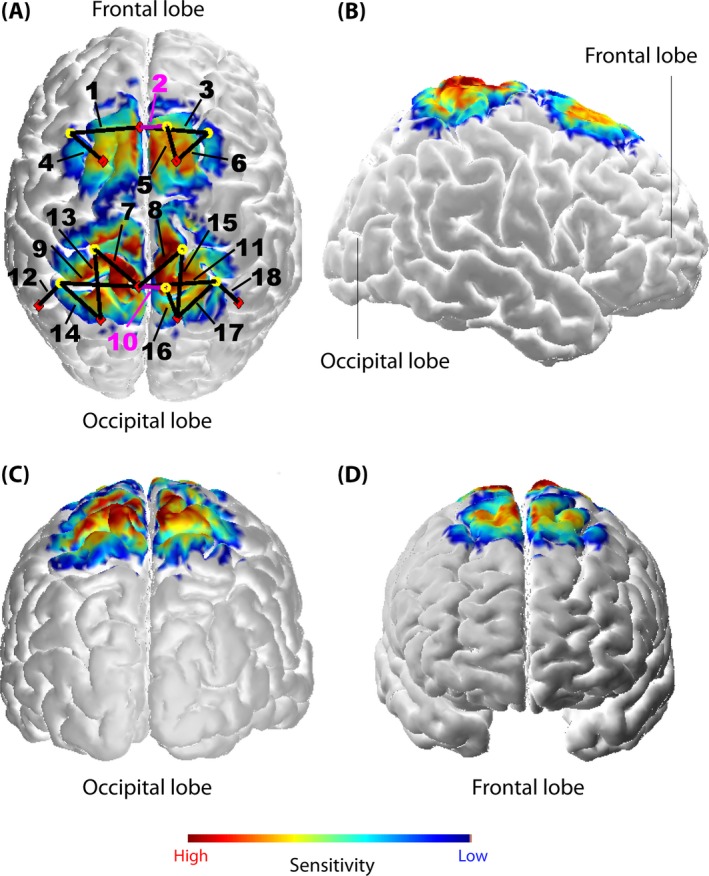
Probe array (A) and its sensitivity profile [per mm] (calculated using AtlasViewer as implemented in HOMER2) from different views (A–D). The probe array displays the sources (red rhombi), the detectors (yellow circles), and the channels (black lines, numbered; the two short‐distance channels are marked with pink lines and numbers). The sensitivity values are displayed in log10 units. The profile was calculated for 10 million photons