
Figure 5.
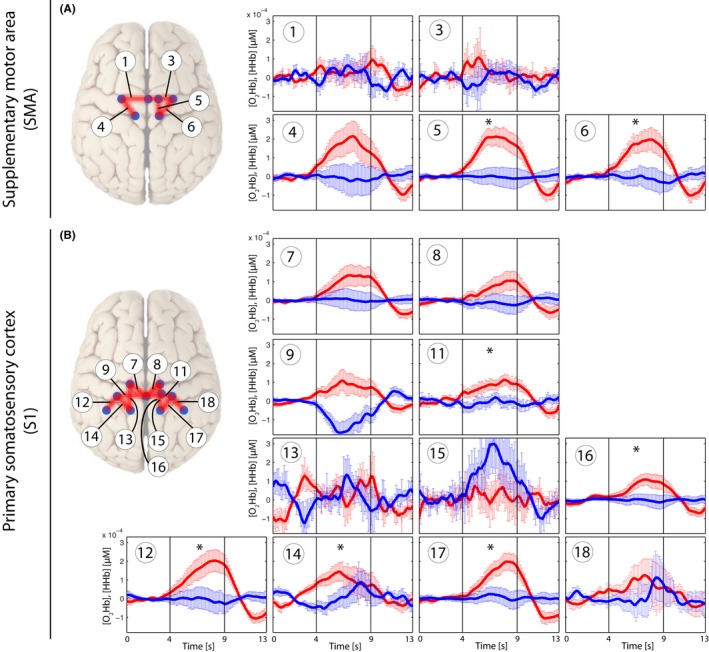
Grand average of evoked hemodynamic changes in all subjects (Analysis_All) due to the painful PA‐pressure stimulus (PAPain) on the SMA (A) and S1 (B). Changes in [O2Hb] (red) and [HHb] (blue) are depicted as changes in the median concentration. The two vertical lines within the graph represent the stimulus on‐ and offset (duration = 5 s). Error bars represent the standard error of the median. Significant changes (q < 0.05; corrected for multiple comparison [via FDR]) are marked with a “*”