
Figure 6.
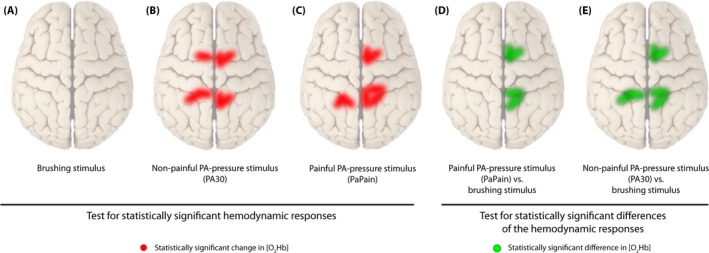
Visualization of statistically significant channels in different comparisons for [O2Hb]. (A) Brushing stimulus versus baseline, (B) Nonpainful posterior‐to‐anterior (PA) stimulus (PA30) versus baseline, (C) Painful PA‐pressure stimulus (PAPain) versus baseline, (D) PAPain versus the brushing stimulus, and finally, (E) PA30 versus the brushing stimulus. Therefore, red lines display statistically significant channels in comparisons versus baseline, whereas green lines display significant channels in comparisons of the conditions against each other (q < 0.05, corrected for multiple comparisons using false discovery rate [FDR])