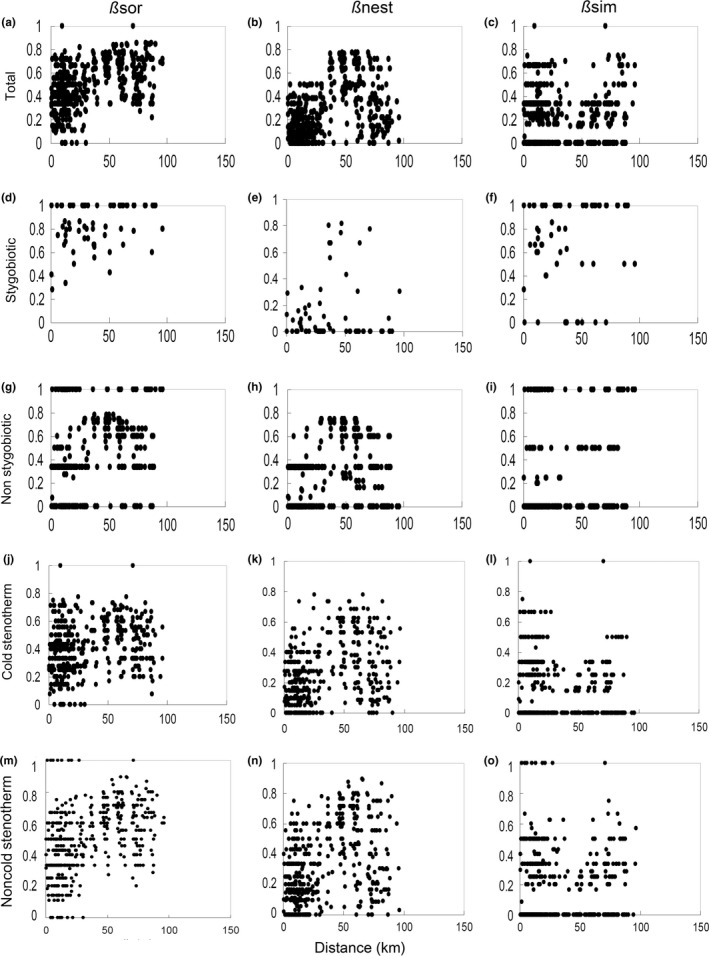
Figure 4.

Relations between interspring distance and overall similarity in species composition (ßsor, a, d, g, j, m) and its nestedness (ßnest, b, e, h, k, n) and turnover (ßsim, c, f, i, l, o) components for total species richness (a–c) and stygobiotic (d–f), nonstygobiotic (g–i), cold stenotherm (j–l), and noncold stenotherm (m–o) species, separately
