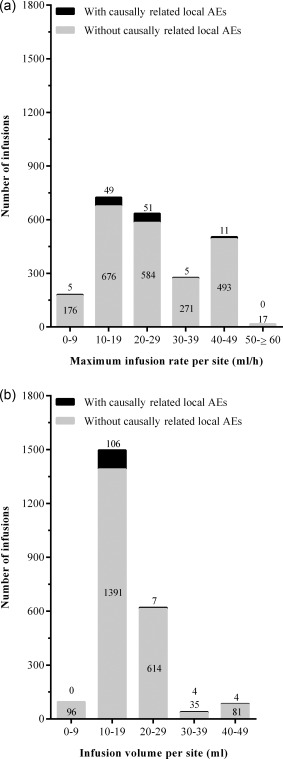
Figure 3.

Tolerability of immunoglobulin (Ig) treatment administered subcutaneously (IGSC) 20% infusions. (a) Infusion volumes; (b) Infusion rates. Numbers above the bars indicate the number of infusions associated with a causally related local AE and numbers inside the bars indicate the number of infusions not associated with any causally related local adverse event (AE). Only infusions with complete infusion histories (n = 2338) have been considered for these analyses.
