
Figure 3.
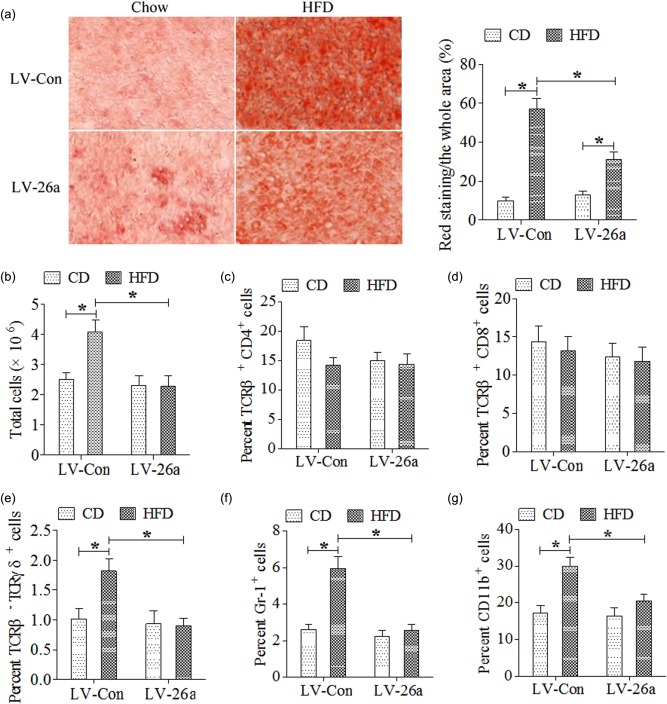
MicroRNA‐26a (Mir‐26a) decreased steatohepatitis on a high‐fat diet (HFD). (a) Representative liver histology (Oil Red O staining) after 20 weeks on chow or HFD; (b) total cells (CD45+) infiltration in liver; (c) T cell receptor (TCR)‐β+CD4+ cells infiltration in liver; (d) TCR‐β+CD8+ infiltration in liver; (e) TCR‐β–TCR‐γδ+ cells infiltration in liver; (f) CD45+ granulocyte‐differentiation antigen‐1 (Gr‐1)+ cells infiltration in liver; (g) CD45+CD11b+ cells infiltration in liver. *P < 0·05; n = 6. [Colour figure can be viewed at wileyonlinelibrary.com]