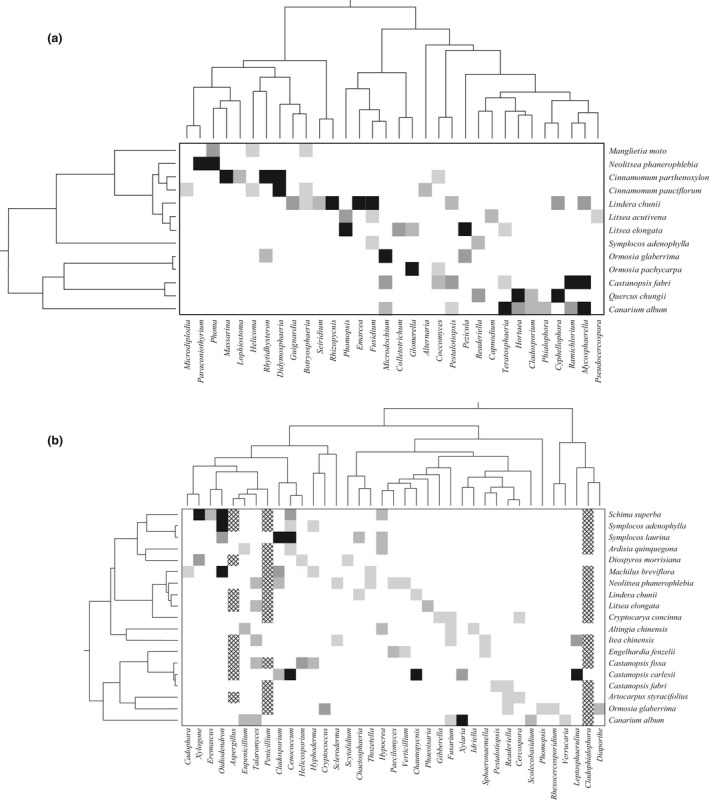
Figure 3.

Schematic representation of host–fungi associations and the phylogenetic structure of subtropical tree species and (a) leaf endophytic fungi or (b) soil‐borne fungi. Each row and column depicts a plant and a fungal species, respectively, and plant and fungus phylogenies are shown besides and above the interaction matrix. The gray scale of the squares indicates interaction strength between hosts and fungi, that is, black indicates the fungus was detected in all the five samples of the corresponding host, and the lightest gray association means the fungus was only found twice out of the five samples. The crosshatch cells show host–fungi associations for the three broad‐spectrum genera which were detected at least three times out of the five samples on more than 10 host species
