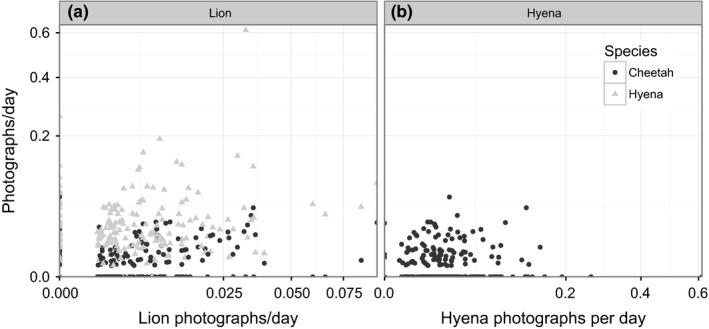
Figure 2.

Photographic capture rates for subordinate versus dominant predators. (a) Cheetah and hyena capture rates (i.e., number of independent photographs per X days) plotted against lion capture rates for each site. (b) Cheetah capture rates plotted against hyena capture rates. Note that all axes are plotted on a square‐root scale
