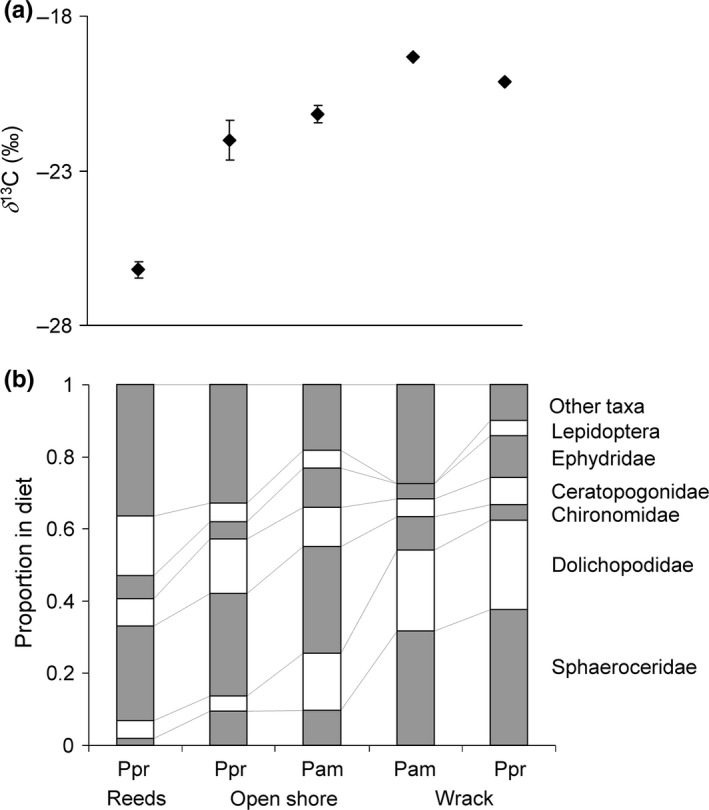
Figure 2.

The carbon isotope composition (a) and the mean proportion of prey in the diets from the molecular gut content analysis (b) for Pardosa prativaga (Ppr) and Pardosa amentata (Pam) on reedy shores, open shores, and on shores with wrack. The order of prey taxa is identical in all groups, with the identity shown on the rightmost group
