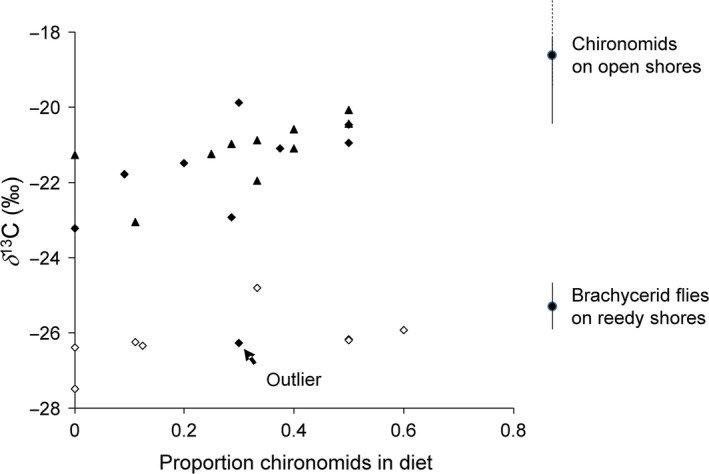
Figure 3.

Relationship between the proportion of chironomids in spider guts, relative to the total number of predation event as revealed by molecular gut content analysis, and the stable isotope composition of spider legs (diamonds = Pardosa prativaga, triangles = Pardosa amentata, filled symbols = open shores, unfilled symbols = reedy shores). An outlier that was excluded from analysis is indicated, see text for justification. The dotted line shows the estimated relationship on open shores. For comparison, the stable isotope composition of chironomids collected on open shores and brachycerid flies from reedy shores is included (data from Enskog, 2006)
